Applications Dashboard
The Chef Automate Applications dashboard allows you to organize and display your applications data from Chef Habitat in an intuitive way. Chef Automate organizes data from the application and environment tags provided by the Chef Habitat supervisor. Under the Chef Automate Applications dashboard, the Service Groups display lets you understand the status of your Chef Habitat services, even when scaling out to large numbers of services.
Prerequisites
The Chef Automate EAS applications feature introduces concepts from Chef Habitat, as introduced in the Glossary.
See Setting up the Applications Dashboard for instructions on configuring Chef Automate and Chef Habitat to work together.
Service Groups
Service groups are Chef Habitat services, which Chef Automate orders by package identifiers and configurations. The Applications dashboard Service Groups display gives you a top-level view of your Chef Habitat services groups and lets you drill down into the status of individual instances to understand the health and contents of any individual instance of a service. The default Service Groups view shows only the services that are available. The right sidebar provides detailed reporting for each individual service.
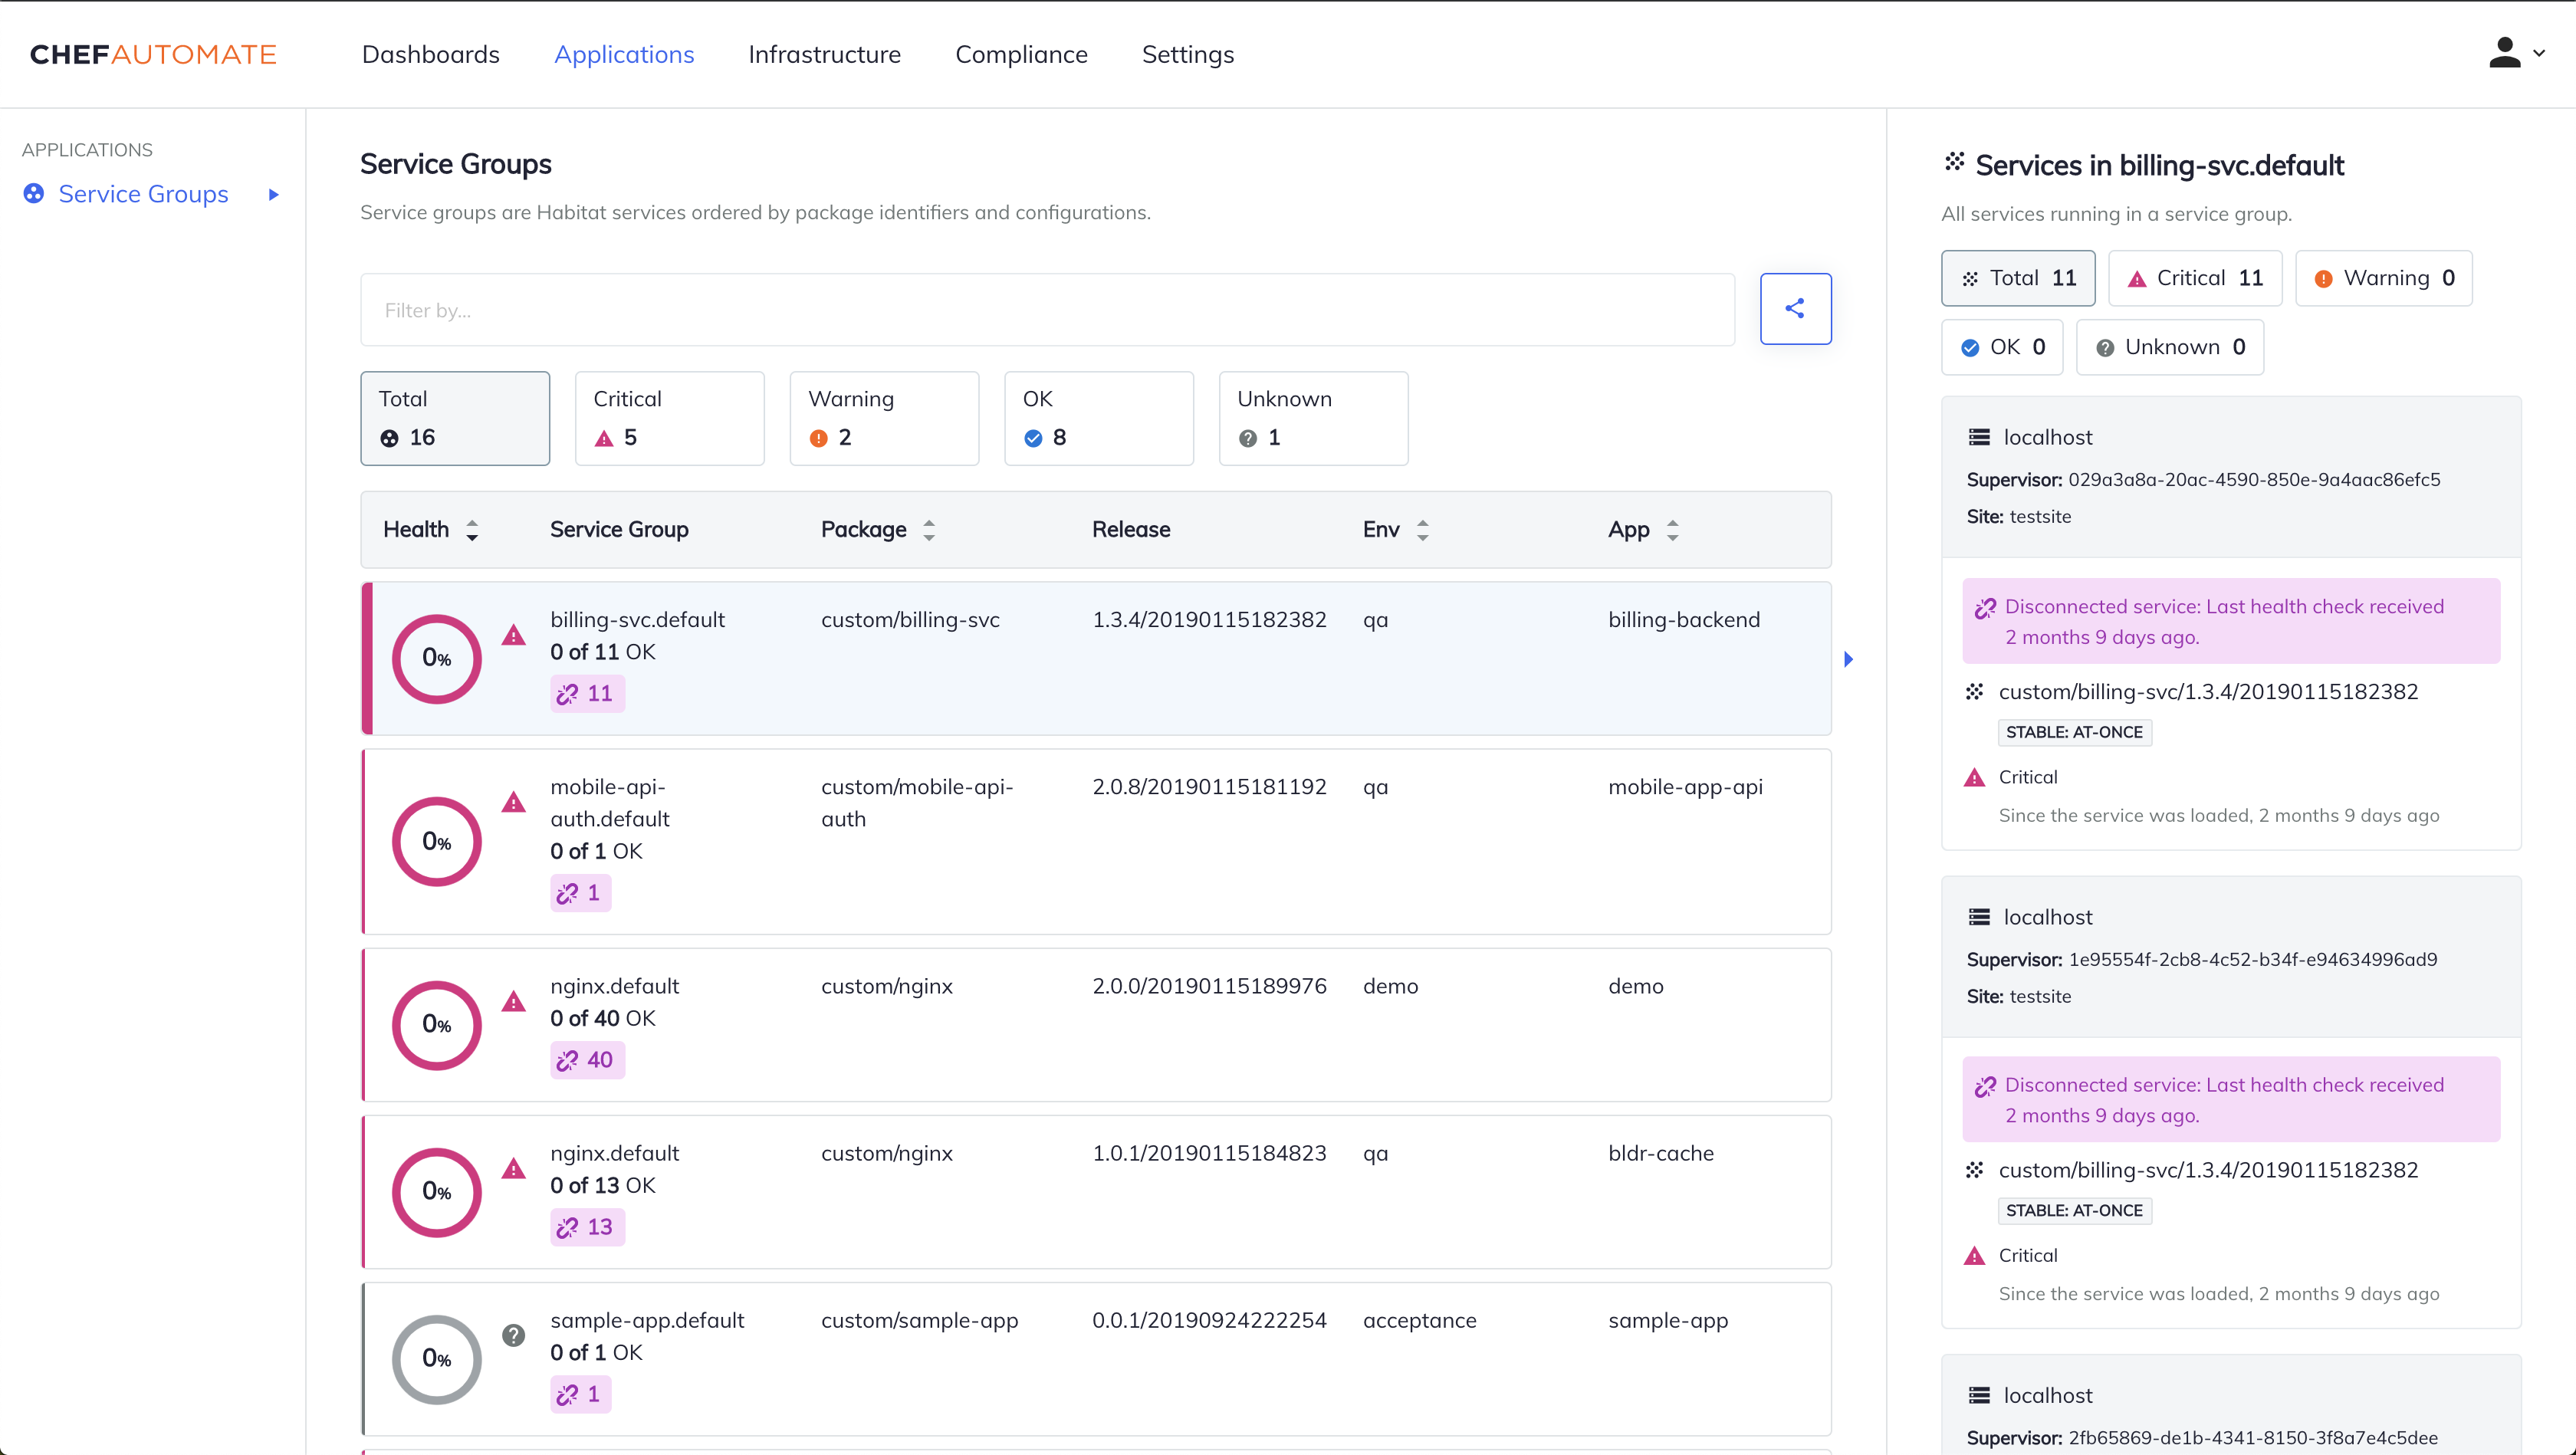
Service Health Status Count
The Service Health Status Count is the first collection of information on the page, which is a series of five containers. The first container on the left reports the total number of service groups and the remaining containers sort the services into four categories of criticality, on the basis of the health status of the most critical service in the group. The service health status containers are Critical, Warning, OK, and Unknown. Each service group is classified by its most critical service, which means that if any one instance in a service group reports a “critical” status, then Chef Automate counts that entire group counts as having a “critical” status. Selecting a container changes the Service Groups table to display only the service groups reporting with that health status.
Service Groups Table
Each row of the Service Groups table displays the results for an individual service group. The rows sort according to the highest criticality, meaning that the service groups reporting the lowest percentage of healthy services–and the highest percentage of “critical” services–appear at the top.
By default, the table rows sort from the smallest to the largest percentage of “OK” services. Selecting the Health column reverses the order, and displays the percentage of “OK” services from largest to smallest.
Health
Under the Health column, the donut chart display shows the proportion of health status via color for the service group. The percentage inside the circle shows the percentage of services with the OK status.
A corresponding status icon with a matching color appears next the circle display if applicable. For example, if a service group is 20% OK and 80% Critical, a magenta triangle exclamation icon appears next to the service group’s circle display and draws attention to the critical status.
If there are multiple Service Groups with the same OK health percentage, then the Service Groups will display in the same order of priority: Critical, Unknown, and Warning.
Service Group
The Service Group column lists the Service Group name and the number of healthy services, which are services reporting an OK status, out of the total number of services in the group. A broken chain icon appears if there are any disconnected services in the group, along with the number of disconnected services.
Additional Service Group Information
The Package column shows the origin and package name.
The Release column displays the version and build in use.
The Env column, which is short for Environment, contains the deployment environment of the service group.
The App column, which is short for Application, displays the application name.
Service Group Details Sidebar
Selecting a Service Group in a row populates the right-hand sidebar with information about each service in the Service Group. To filter the individual services in the side bar by their health status, select one of the health status buttons at the top of the sidebar.
The individual service rows sort by their level of criticality, from the “most critical” status to the “least critical” status - “critical”, “warning”, “unknown”, and “OK” respectively. Individual disconnected services display a broken chain icon with a note of when the last received health check occurred. The most critical issues appear at the top of the list, allowing you to determine the next steps for remediation.
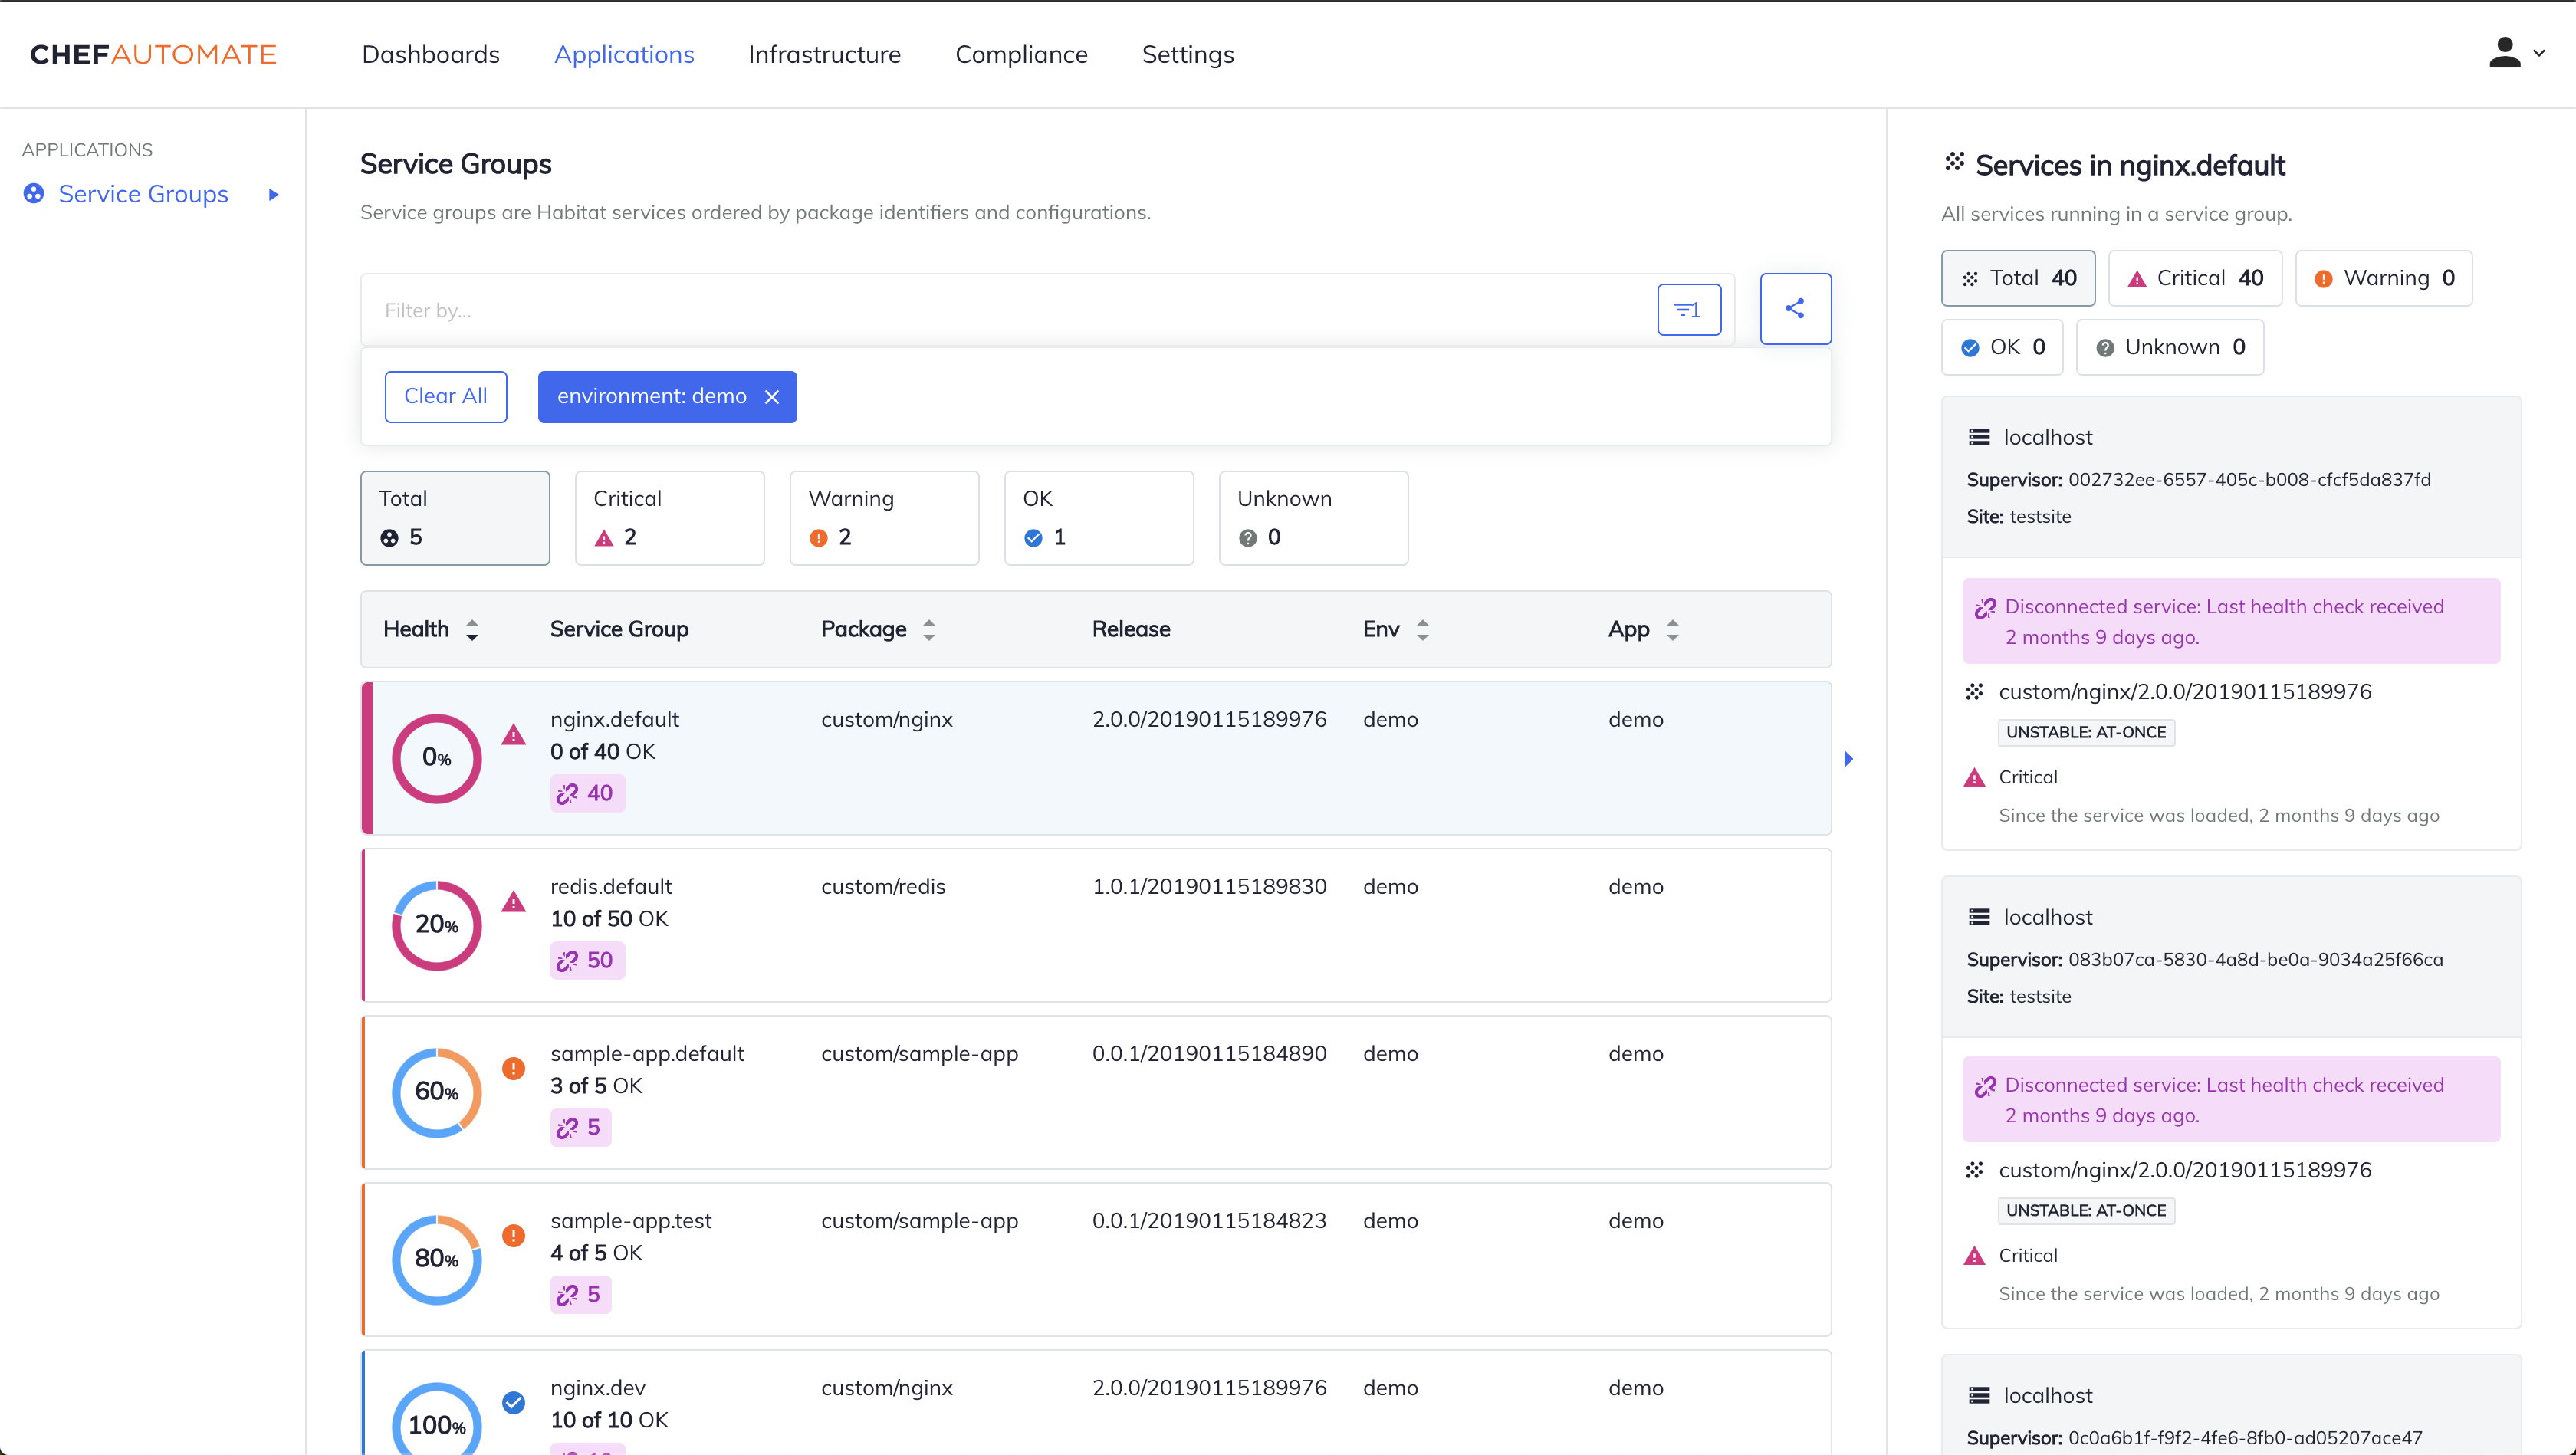
Filtering Results
Use the search bar at the top of the page to filter the results in the main table. Select the search bar, select your search field type from the drop-down menu. Available search field types include Origin, Service Name, Version, Channel, Application, Environment, Site, Build Timestamp, and Group Name.
After selecting your search field type, enter your specific search term, or select one from the auto-populated list of existing values. Applying the filter changes the Service Groups list to display matching results and updates health status display accordingly.
Lifecycle Management
Disconnected services are defined services that haven’t reported back with a health check message for a user-defined period of time.
Use the Service Group Data Lifecycle settings to manage the activity of periodic jobs, and to assess disconnection status and removal of services.
Periodic Disconnection Checks
Chef Automate assesses the status of Chef Habitat services based on the receipt of a health check message.
Chef Automate marks a node as disconnected when it doesn’t receive a health check message in a set amount of time.
Use the threshold configuration to set the amount of time between the last node health check message and when Chef Automate marks it as disconnected.
Health checks are mandatory and you can’t disable health checks.
The default time for a node to report to Chef Automate is 5 minutes.
Chef Habitat sends the health check messages every 30 seconds by default.
Configure this setting using the --health-check-interval option with the hab sup run command.
See the Habitat CLI documentation for more information.