Reports
The Reports page provides a comprehensive insight into all scanned infrastructure compliance status. Scan results for audit cookbook configurations also appear in this view.
Note
Dates in Compliance Reports
The dashboard shows the results of all scans with end times on the current selected day. Chef Automate bases the current selected day on timestamps in Coordinated Universal Time (UTC). The trend graph provides a historical overview of node status over time. You can change it to display overviews of the past ten days, one month, three months, or one year.
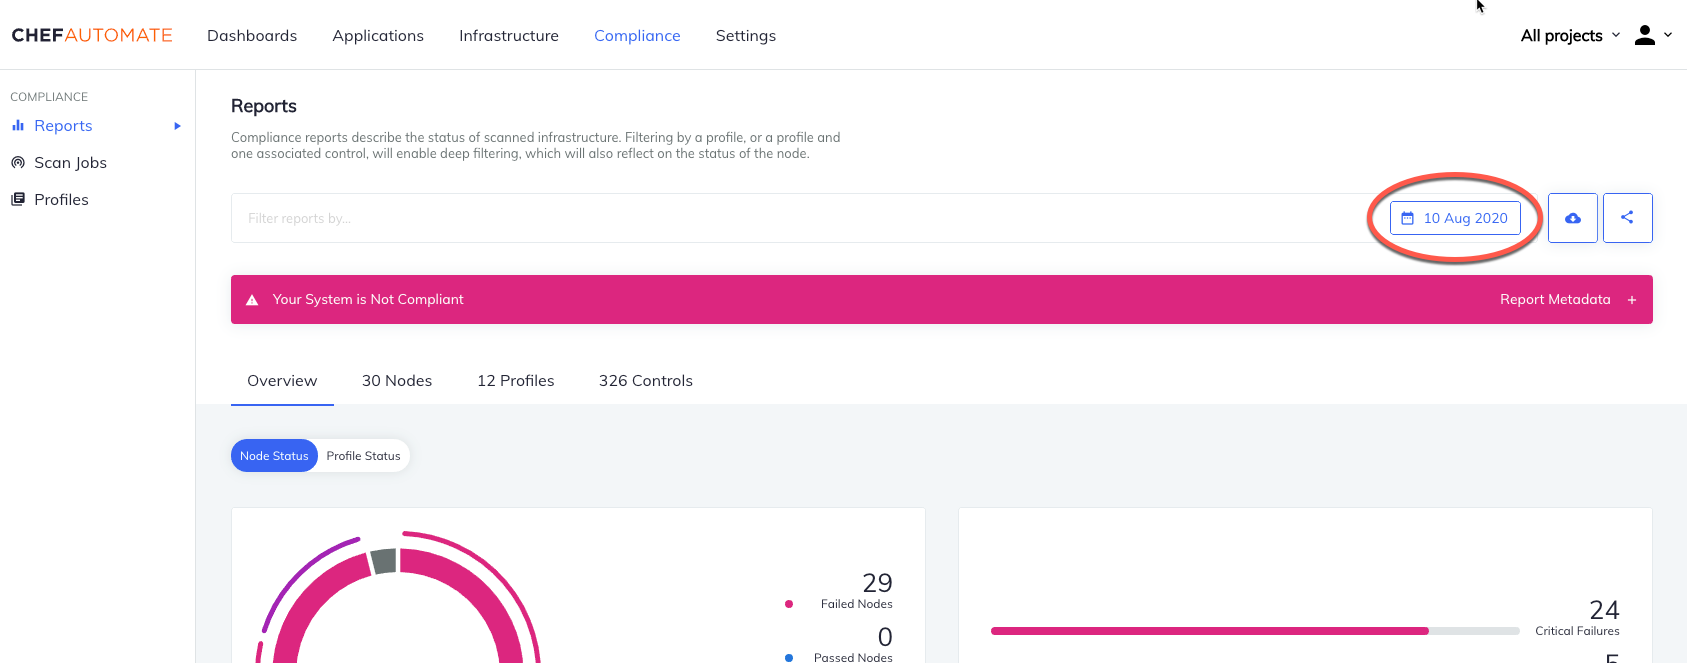
To view scan reports in the past, users can select a different date from the calendar located in the search bar.
Search Bar and Filters
The Compliance search allows you to view and filter compliance scan results based on a defined set of filters.
Wildcard searches on field values won’t return suggestions, but they will filter the results.
For example, you can search for Node Name: prod* and filter the results to list all the node names that begin with prod.
- Chef Infra Server
- Filter your results by Chef Infra Server.
- Chef Organization
- Filter your results by Chef organization.
- Chef Tag
- Filter your results by Chef tag.
- Control Tag
- Filter your results by control tag.
- Controls
- Filter your results by control name. Filtered results display the status of nodes that ran the selected control.
- Environment
- Filter your results by the environment.
- Chef InSpec Version
- Filter your results by Chef InSpec version.
- Node Name
- Filter your results by node name.
- Platform
- Filter your results by platform.
- Policy Group
- Filter your results by policy group.
- Policy Name
- Filter your results by policy name.
- Profile
- Filter your results by profile name. This lists executed profiles, which are profiles with received scan results.
- Recipe
- Filter by Chef recipe on all applicable nodes.
- Role
- Filter by Chef role on all applicable nodes.
Deep Filtering
Deep filtering provides reports on compliance profiles and controls. Apply deep filtering to see the compliance reporting for a profile version or one of its controls.
Chef Automate saves computational time and storage space by calculating compliance reporting statistics at the total level. Deep filtering uses the profile_id attribute to drill down to the granular level of your compliance status. In contrast, filtering with the profile_name attribute instead of profile_id creates a report for every version of profile_name in your infrastructure.
Deep filtering supports reports for:
- one profile
- one profile and one of its associated controls
Profile Deep Filtering
Deep Filtering with profile_id scopes a compliance report to a versioned profile.
To create a report at the profile level:
- Specify the profile in the filter using
profile_id - Leave the control filter empty
- Apply more reporting filters
Control Deep Filtering
Deep filtering for a control scopes a compliance report to a single control within a versioned profile.
To create a report at the control level:
- Enter the
profile_idin the filter - Add a control
- Apply more reporting filters
If the results returned by your deep filter are incorrectly scoped, review the profile_id and control field contents.
Waivers
A node’s waived status appears if applicable in displays where a node’s status appears in Chef Automate. The Compliance Reports overview displays the node count, history of waived nodes, and the count and history of waived controls. Nodes and Profiles views include Waived Nodes and Waived Profiles status filters, respectively. The Waived status filter displays the respective Node or Profile reporting with the waived status. Hover over the control’s Waived icon under the Node Status column in Controls to view more details about the waiver applied to the control.
Use Chef InSpec to configure waivers.
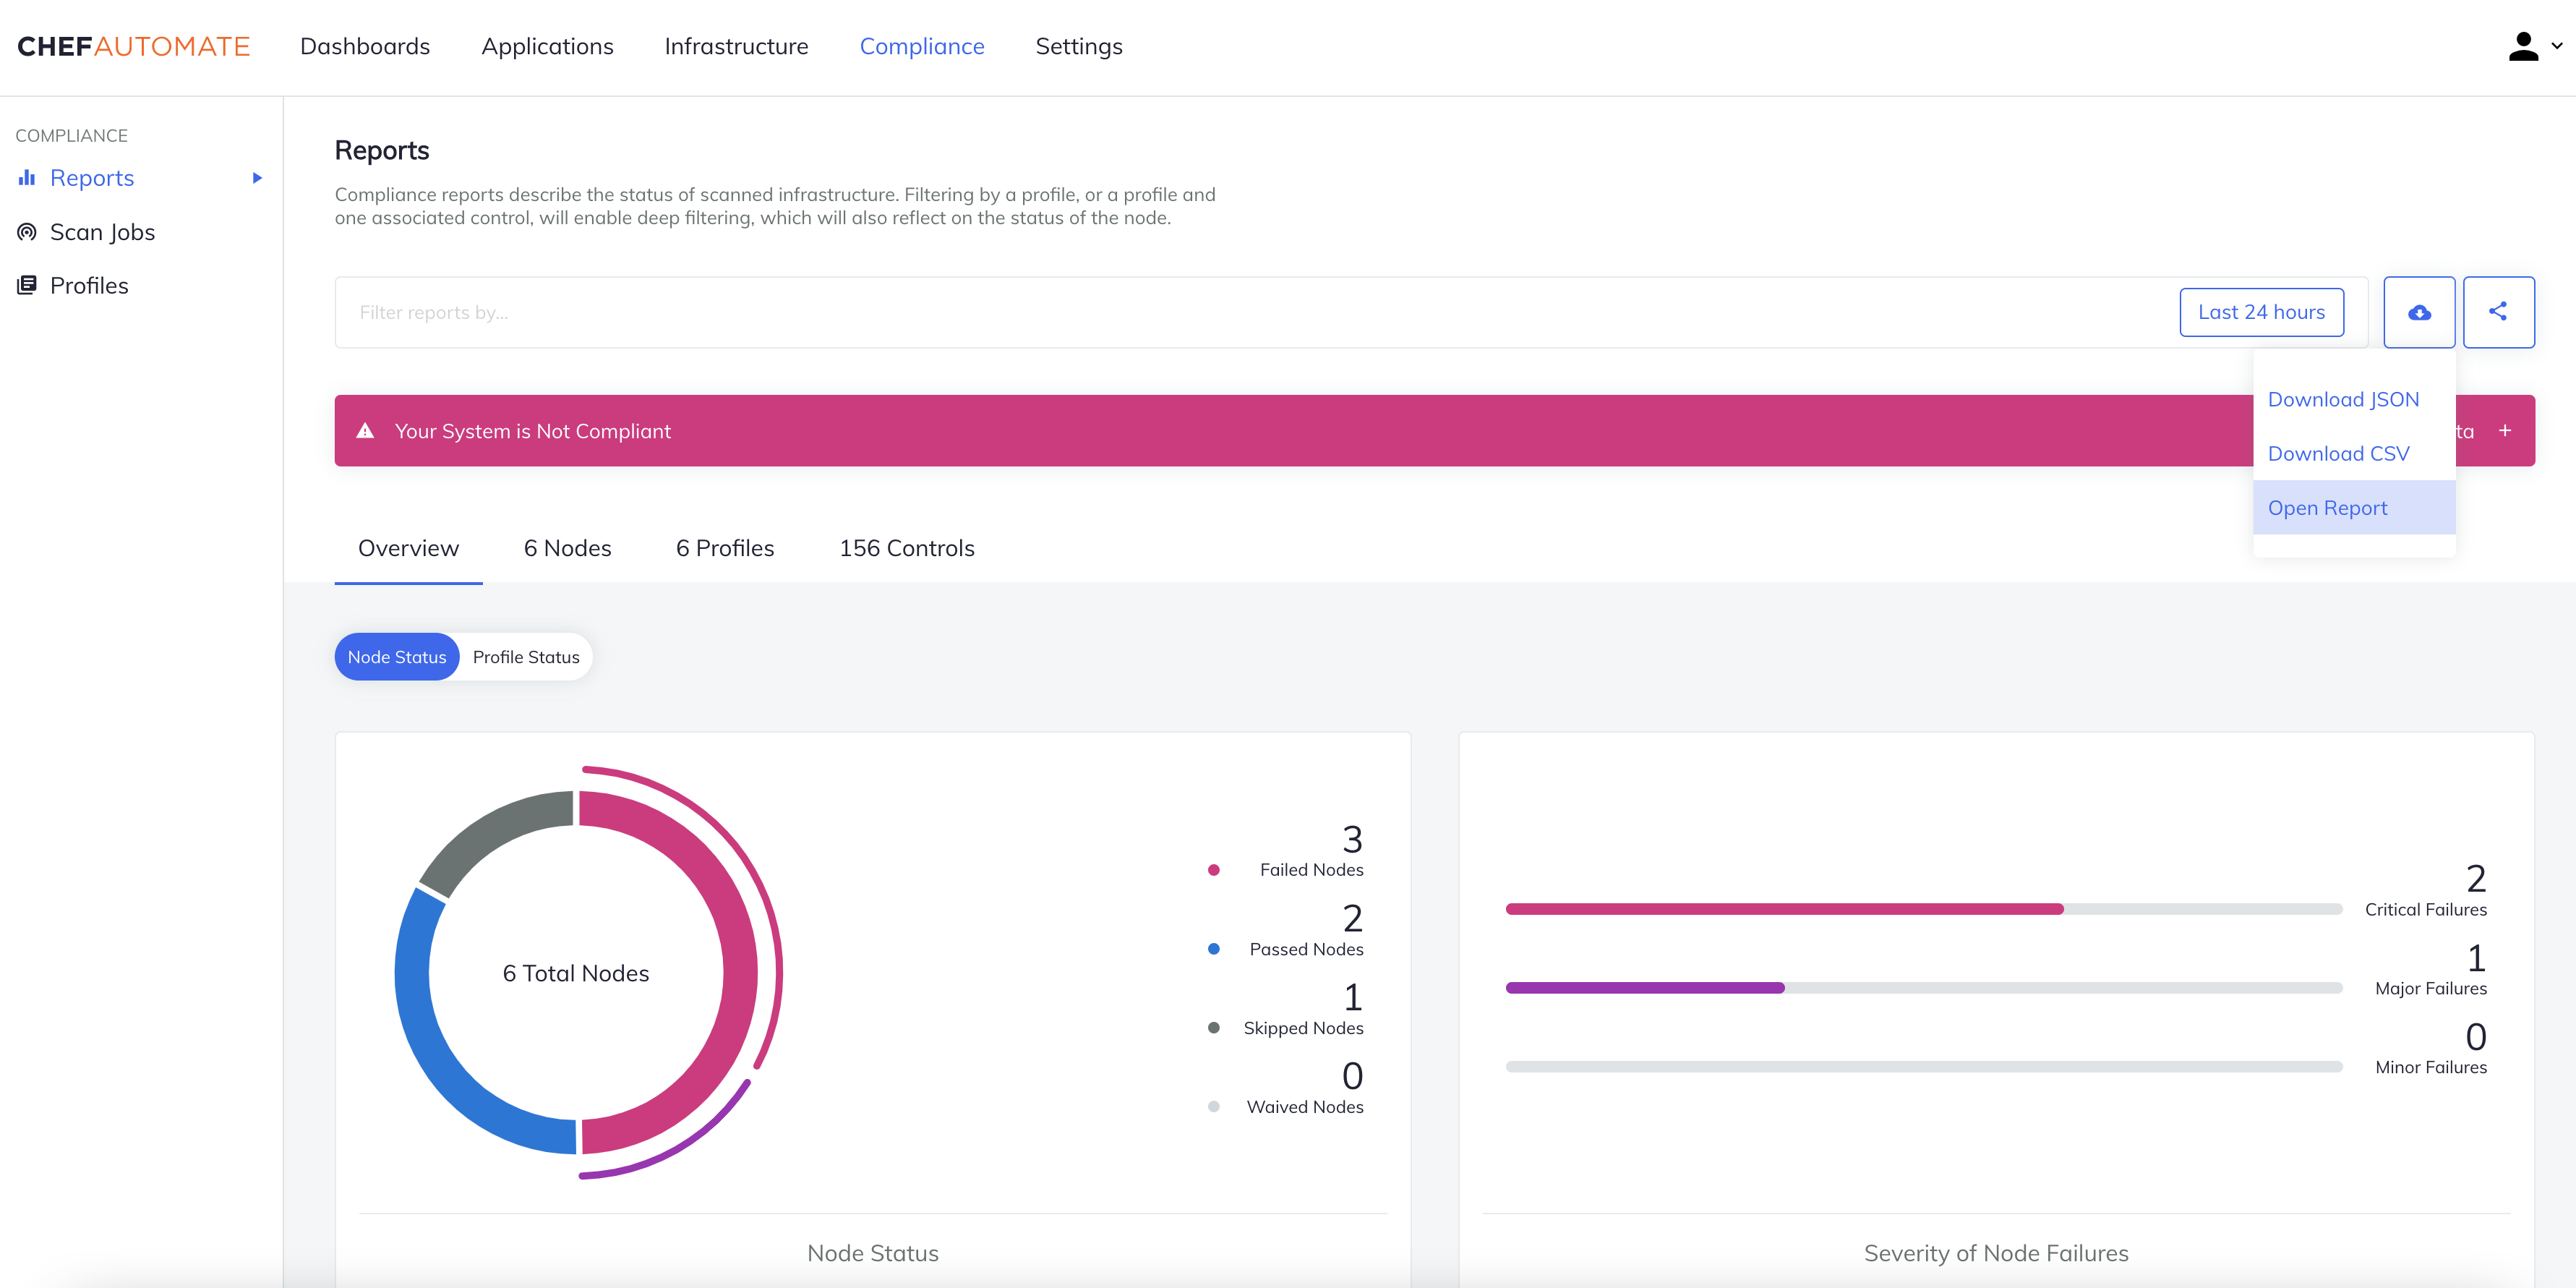
Download Report Results (Default Configuration)
The download button to the right of the search bar allows users to download a JSON or CSV format of the reports. The downloaded contents result from all the applied filters–including the end time selected in the calendar.
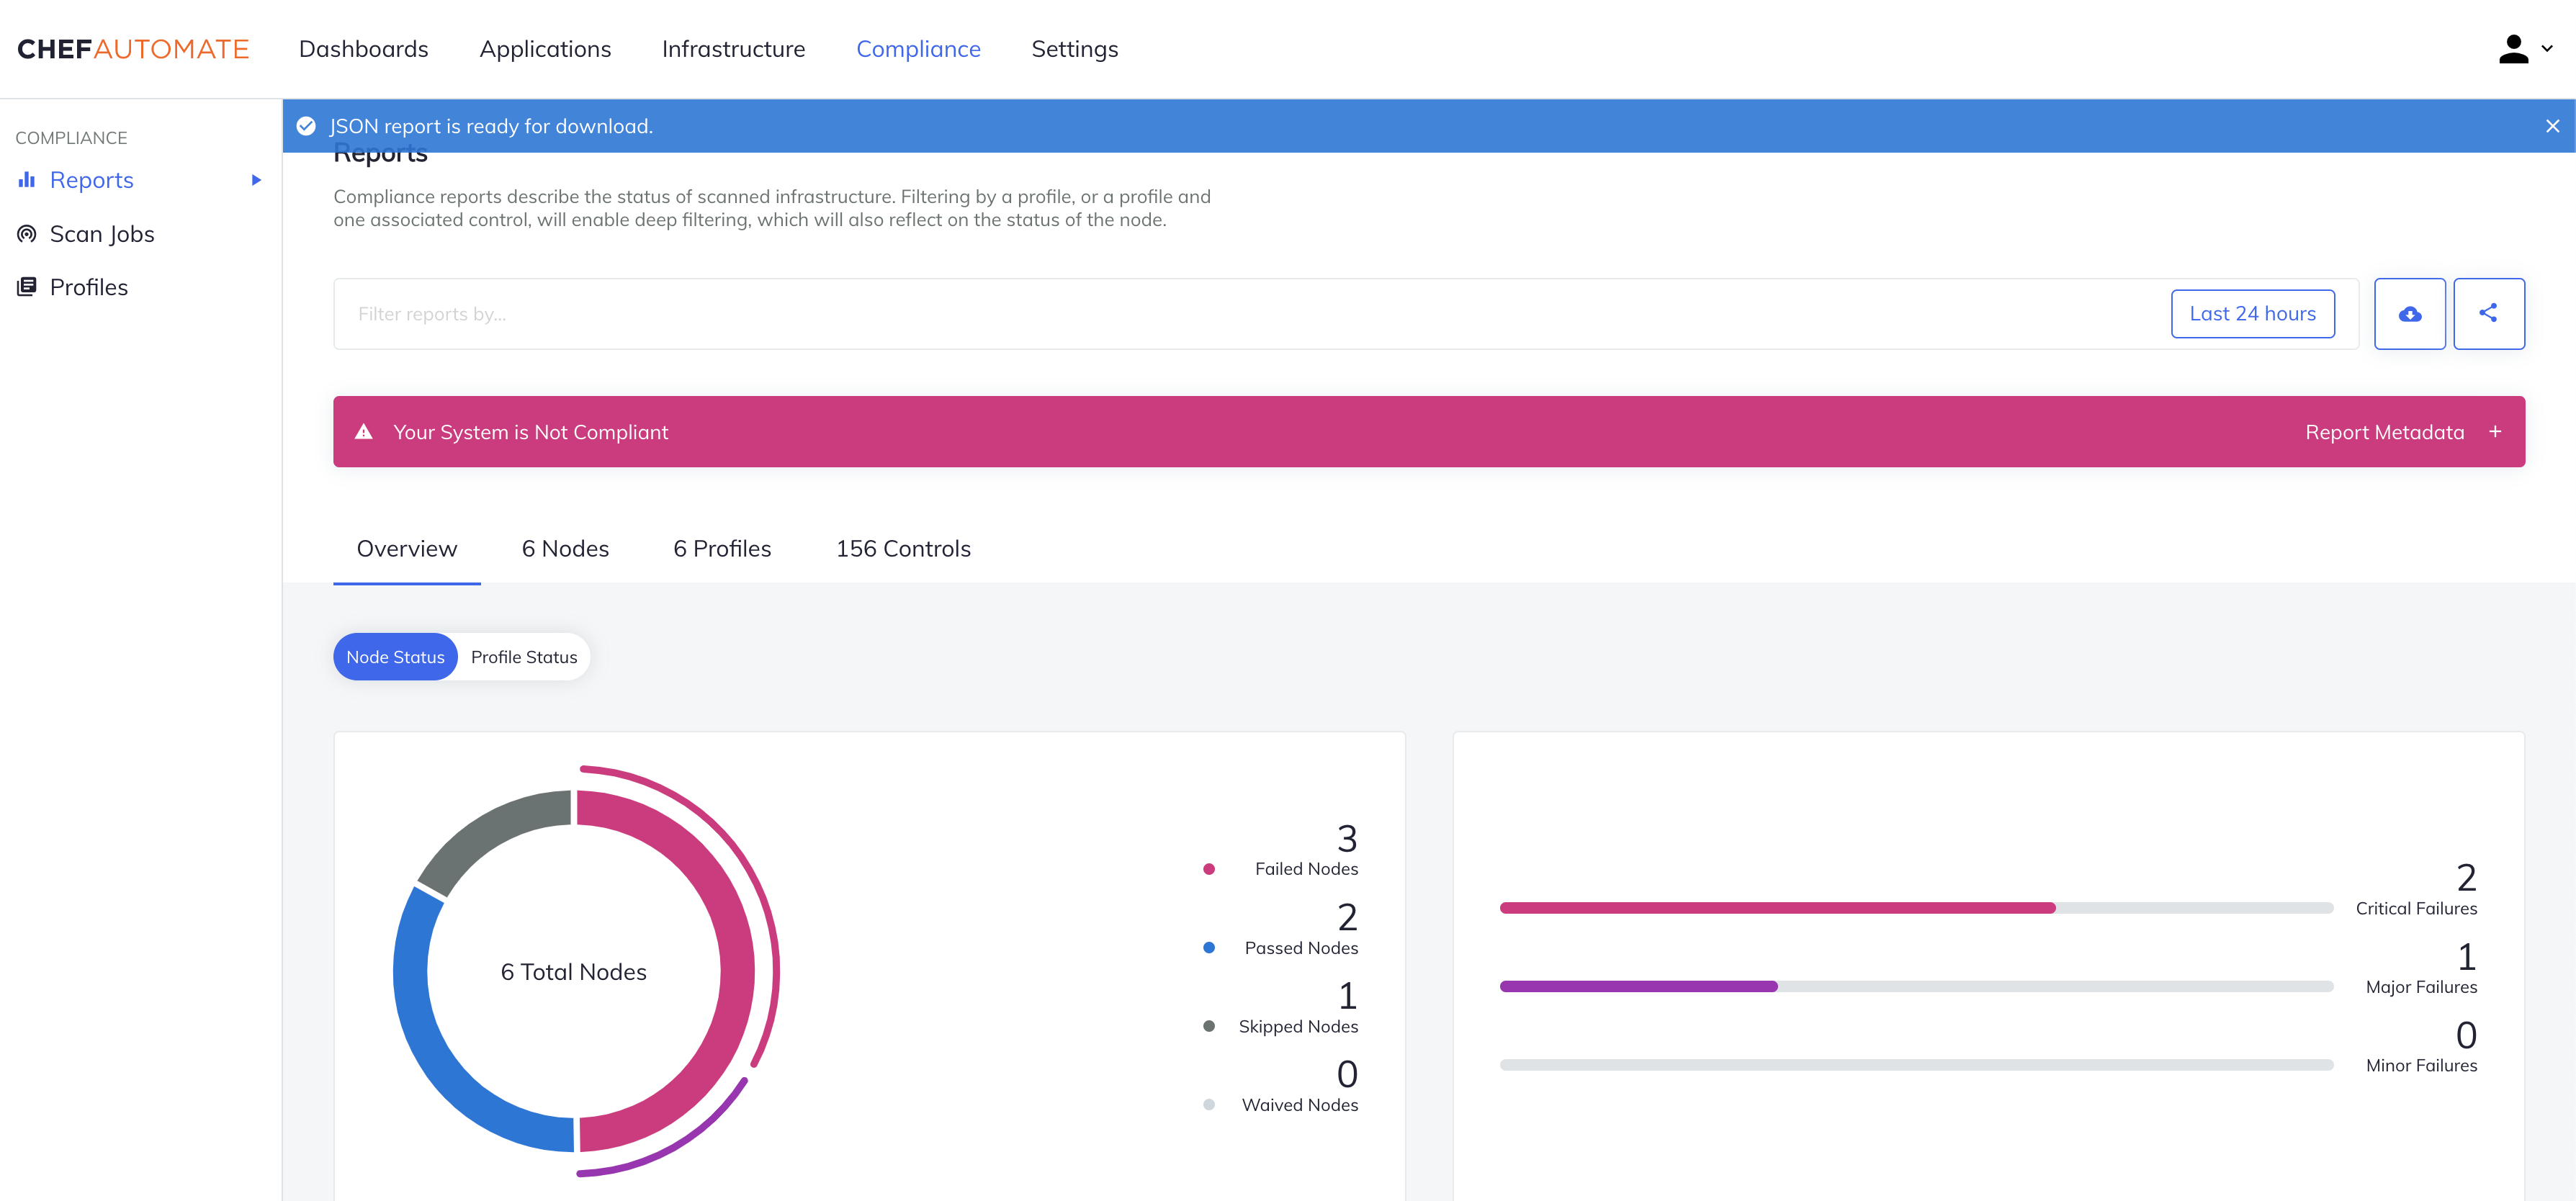
Download Report Results (With Large Compliance Report Configuration)
When you configure Chef Automate to ingest an extensive compliance report of size more than 4MB, the download of the report becomes a two-step engagement:
Step1: Generate the report in the requested format from the object storage with all the applied filers, including the end time selected.
Step2: Make the report available for download.
Generate Report
- Select Download JSON or Download CSV buttons to trigger the report generation process. A notification pops up to confirm that the generation has started.
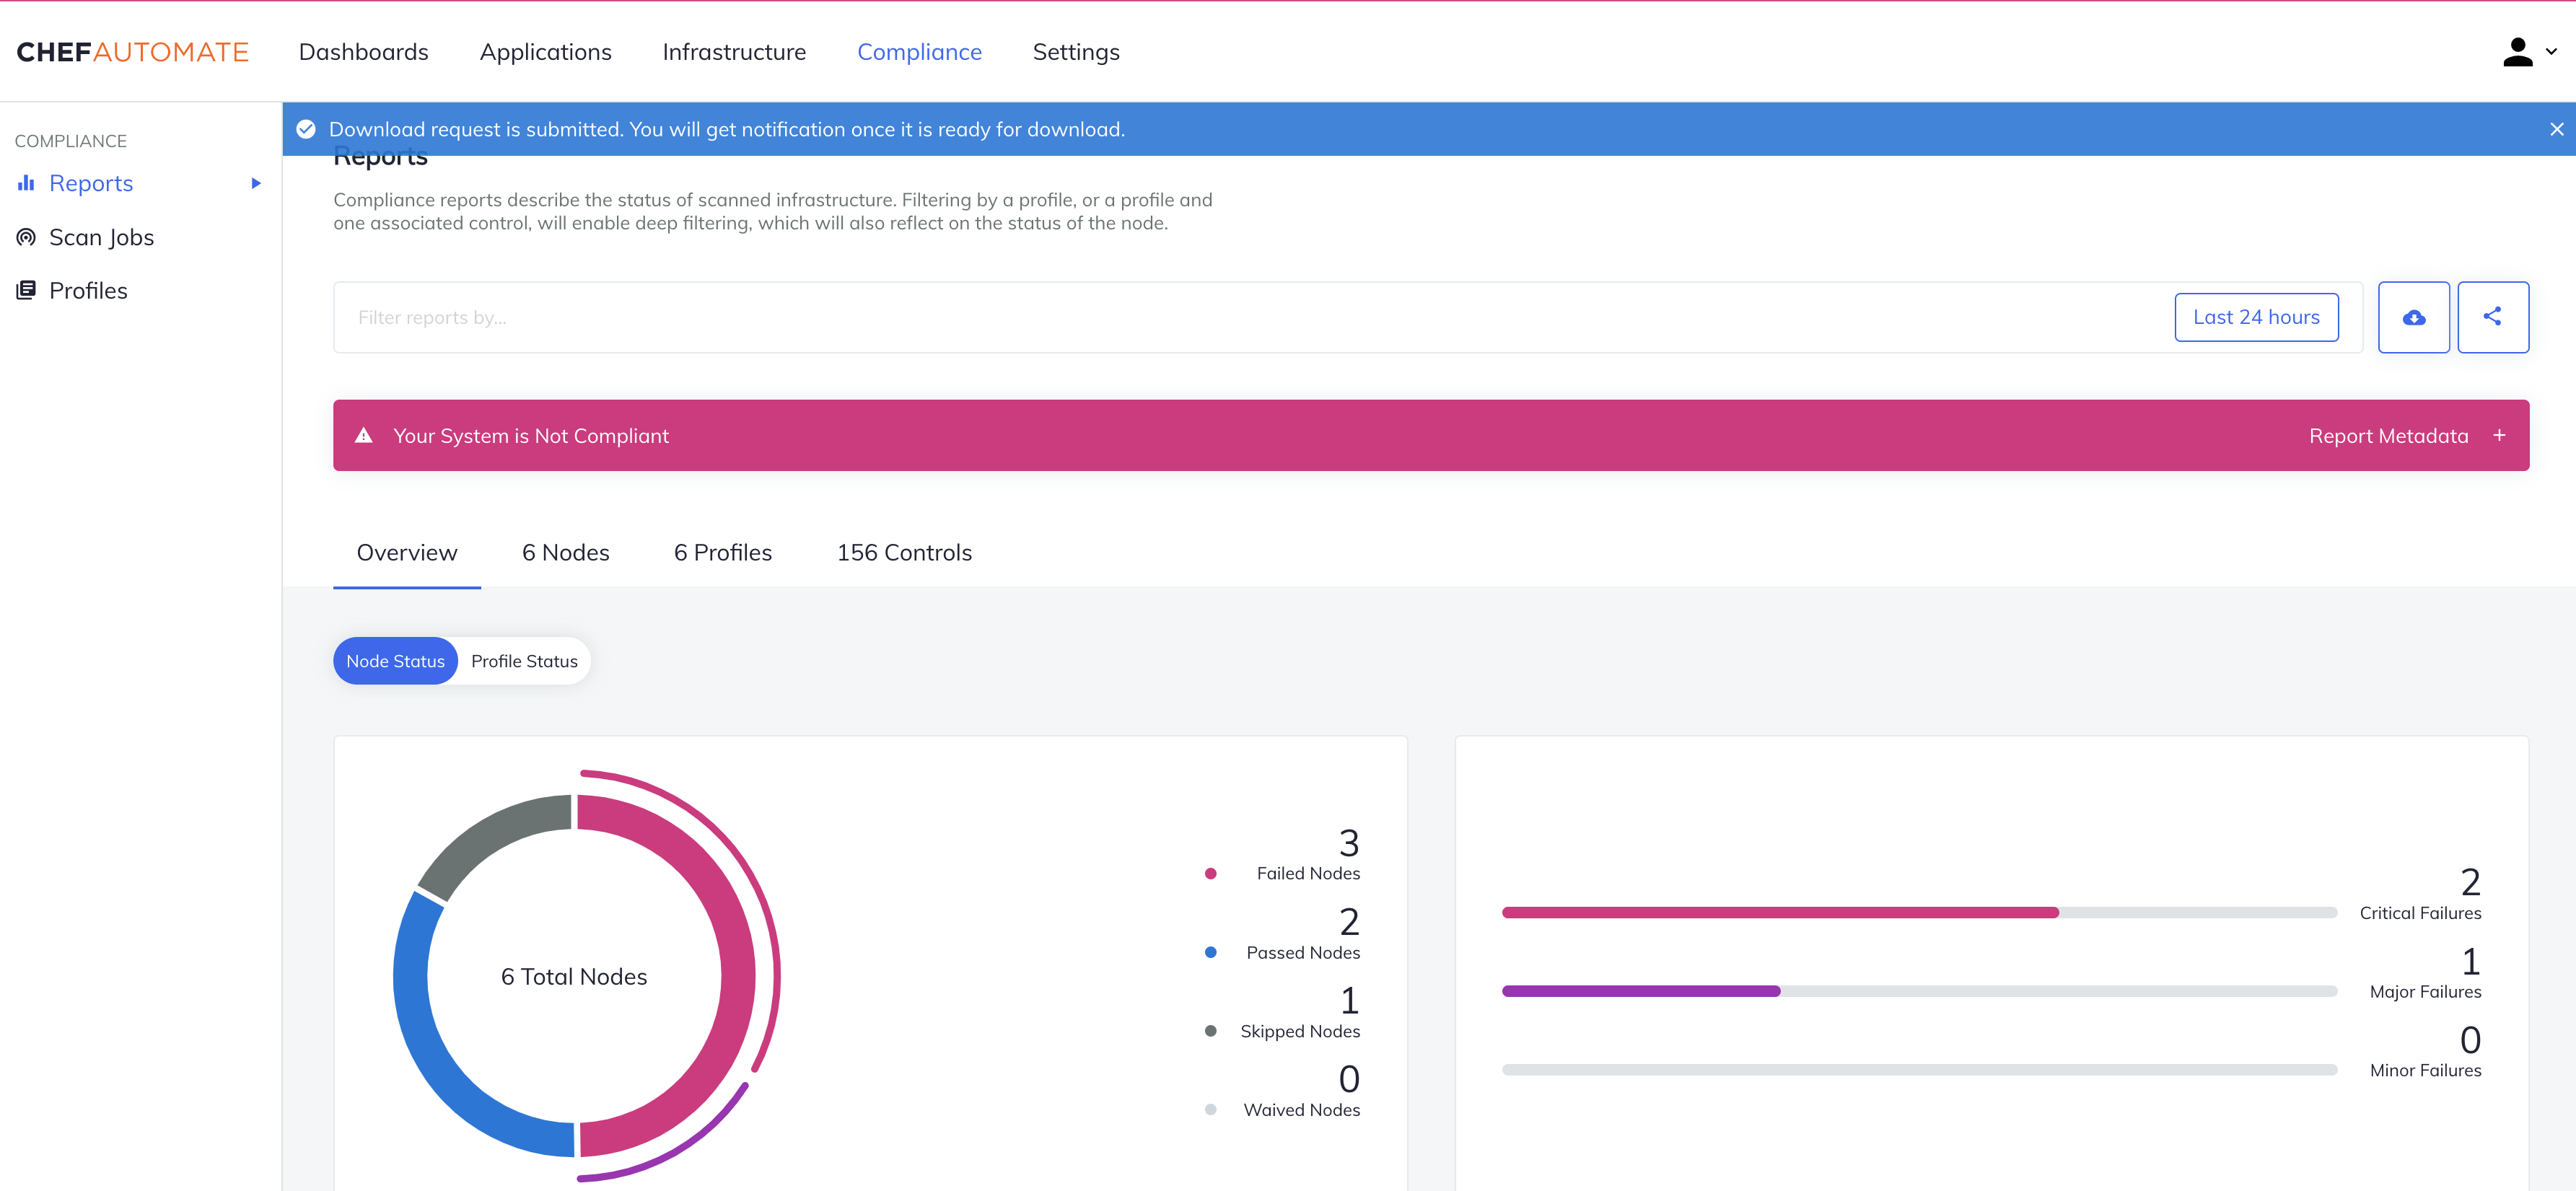
- Select Open Report link to view the report status.
- The report’s status shows the generation and processing status of the Reports on a sidebar.
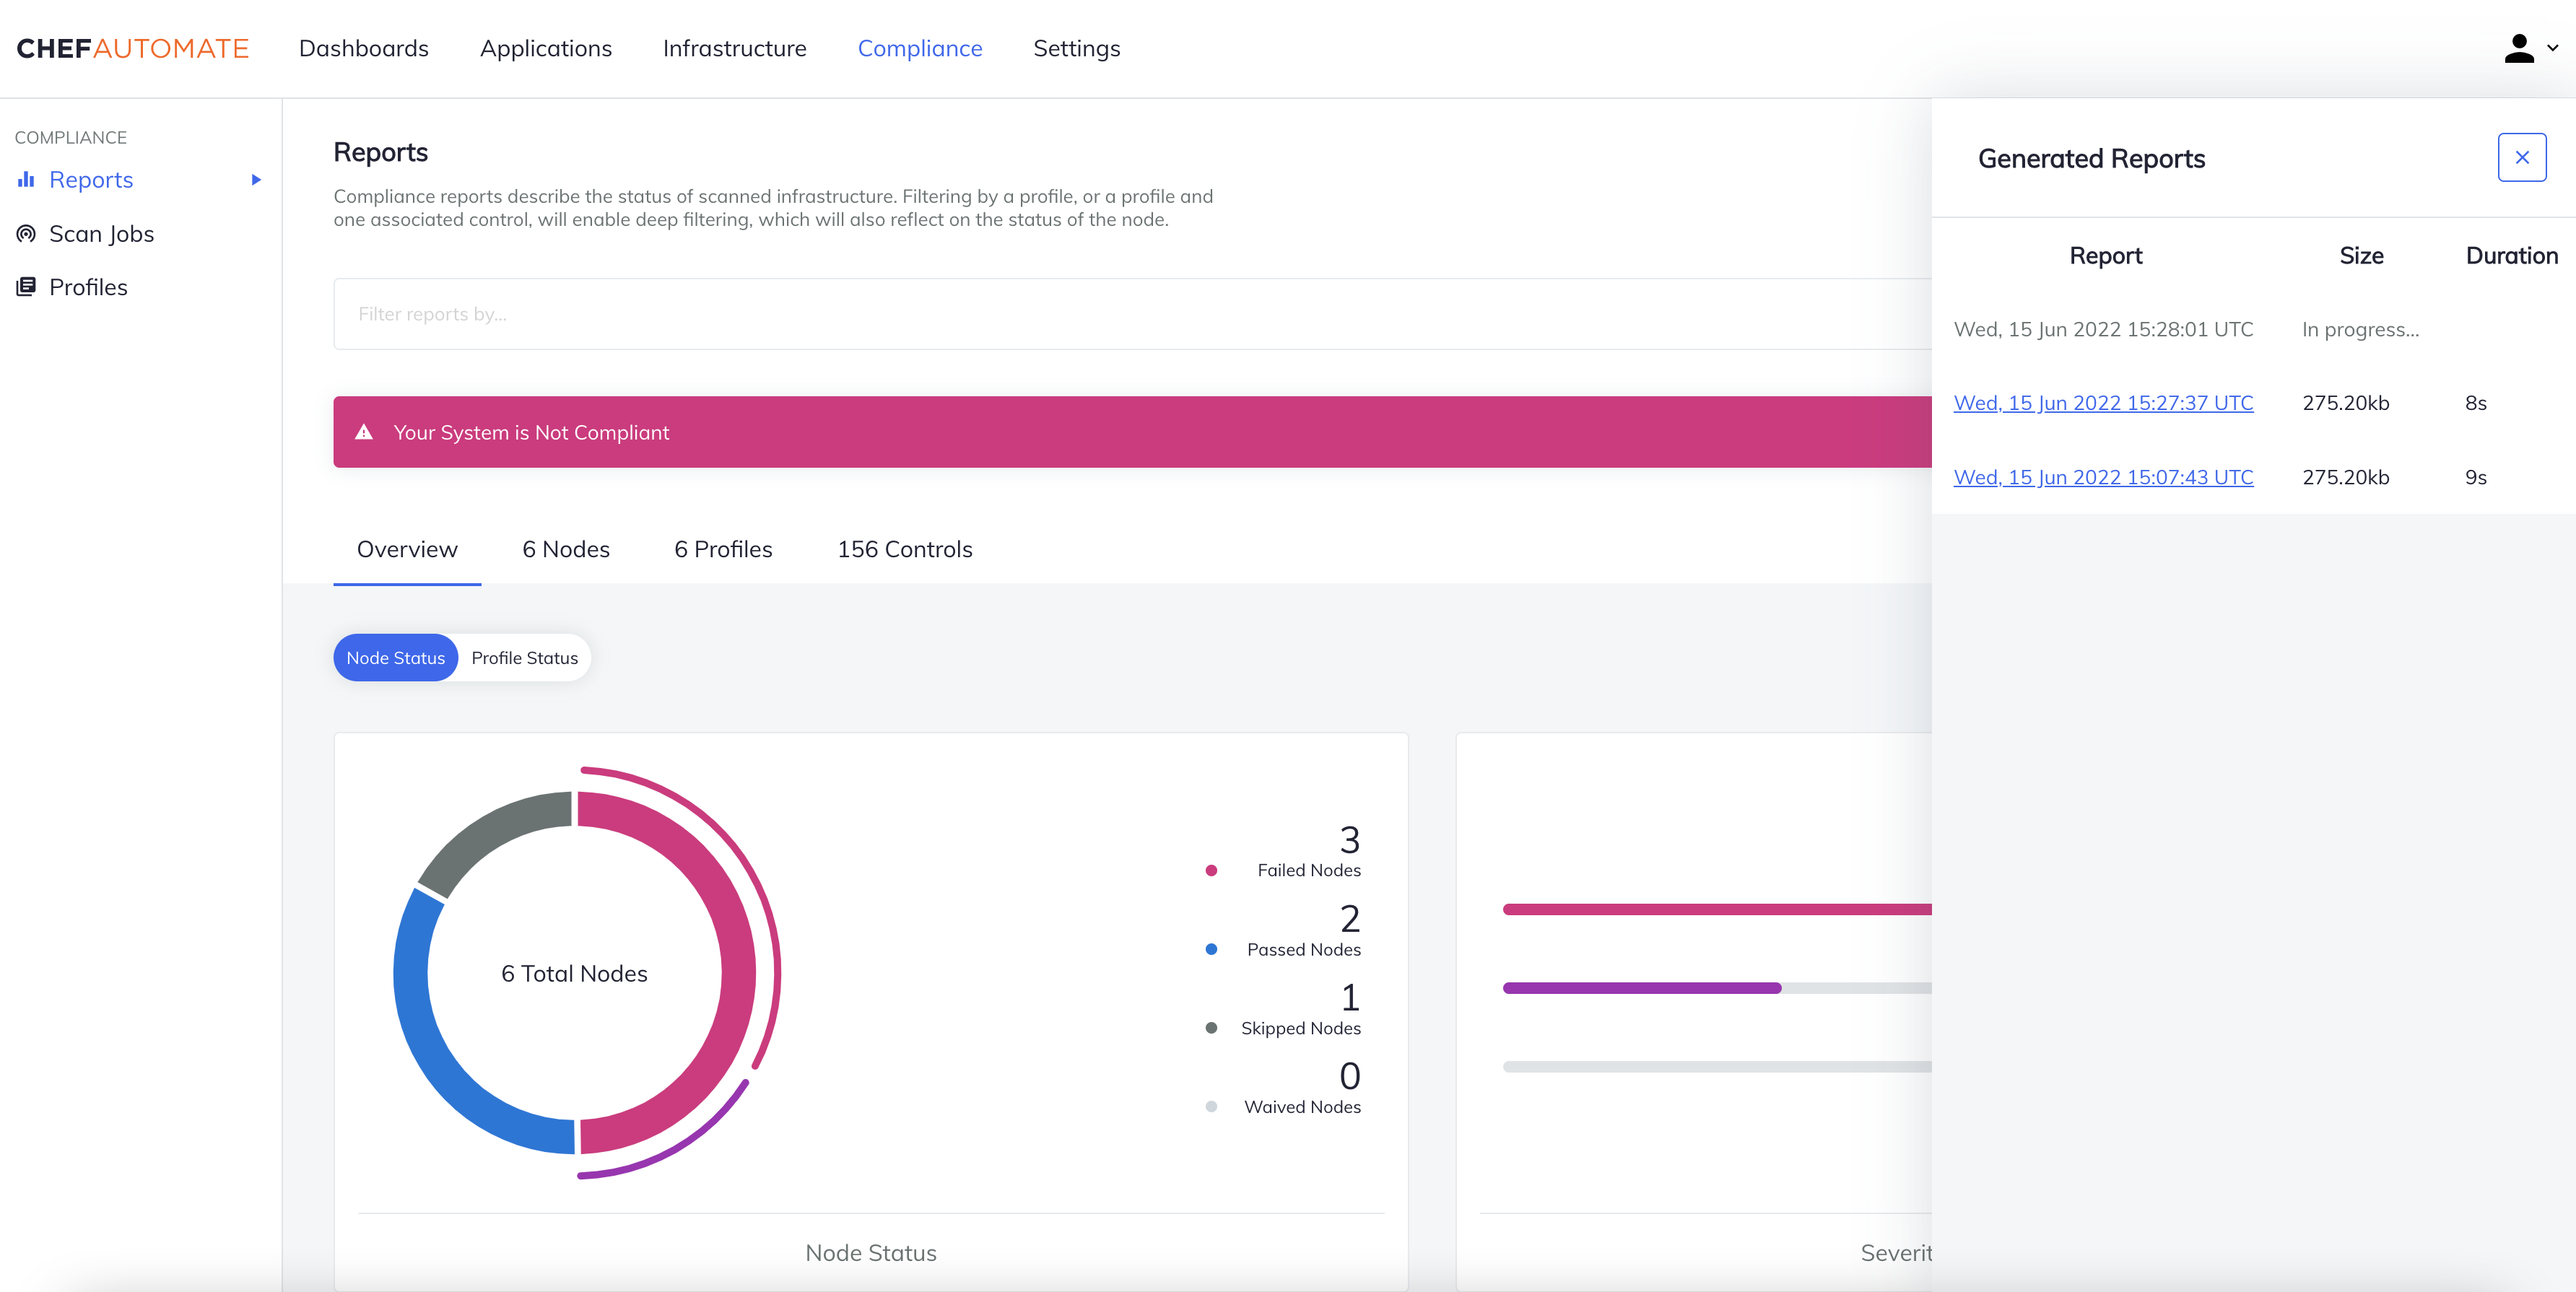
- The system generates and processes the requested report on a sidebar showing the status.
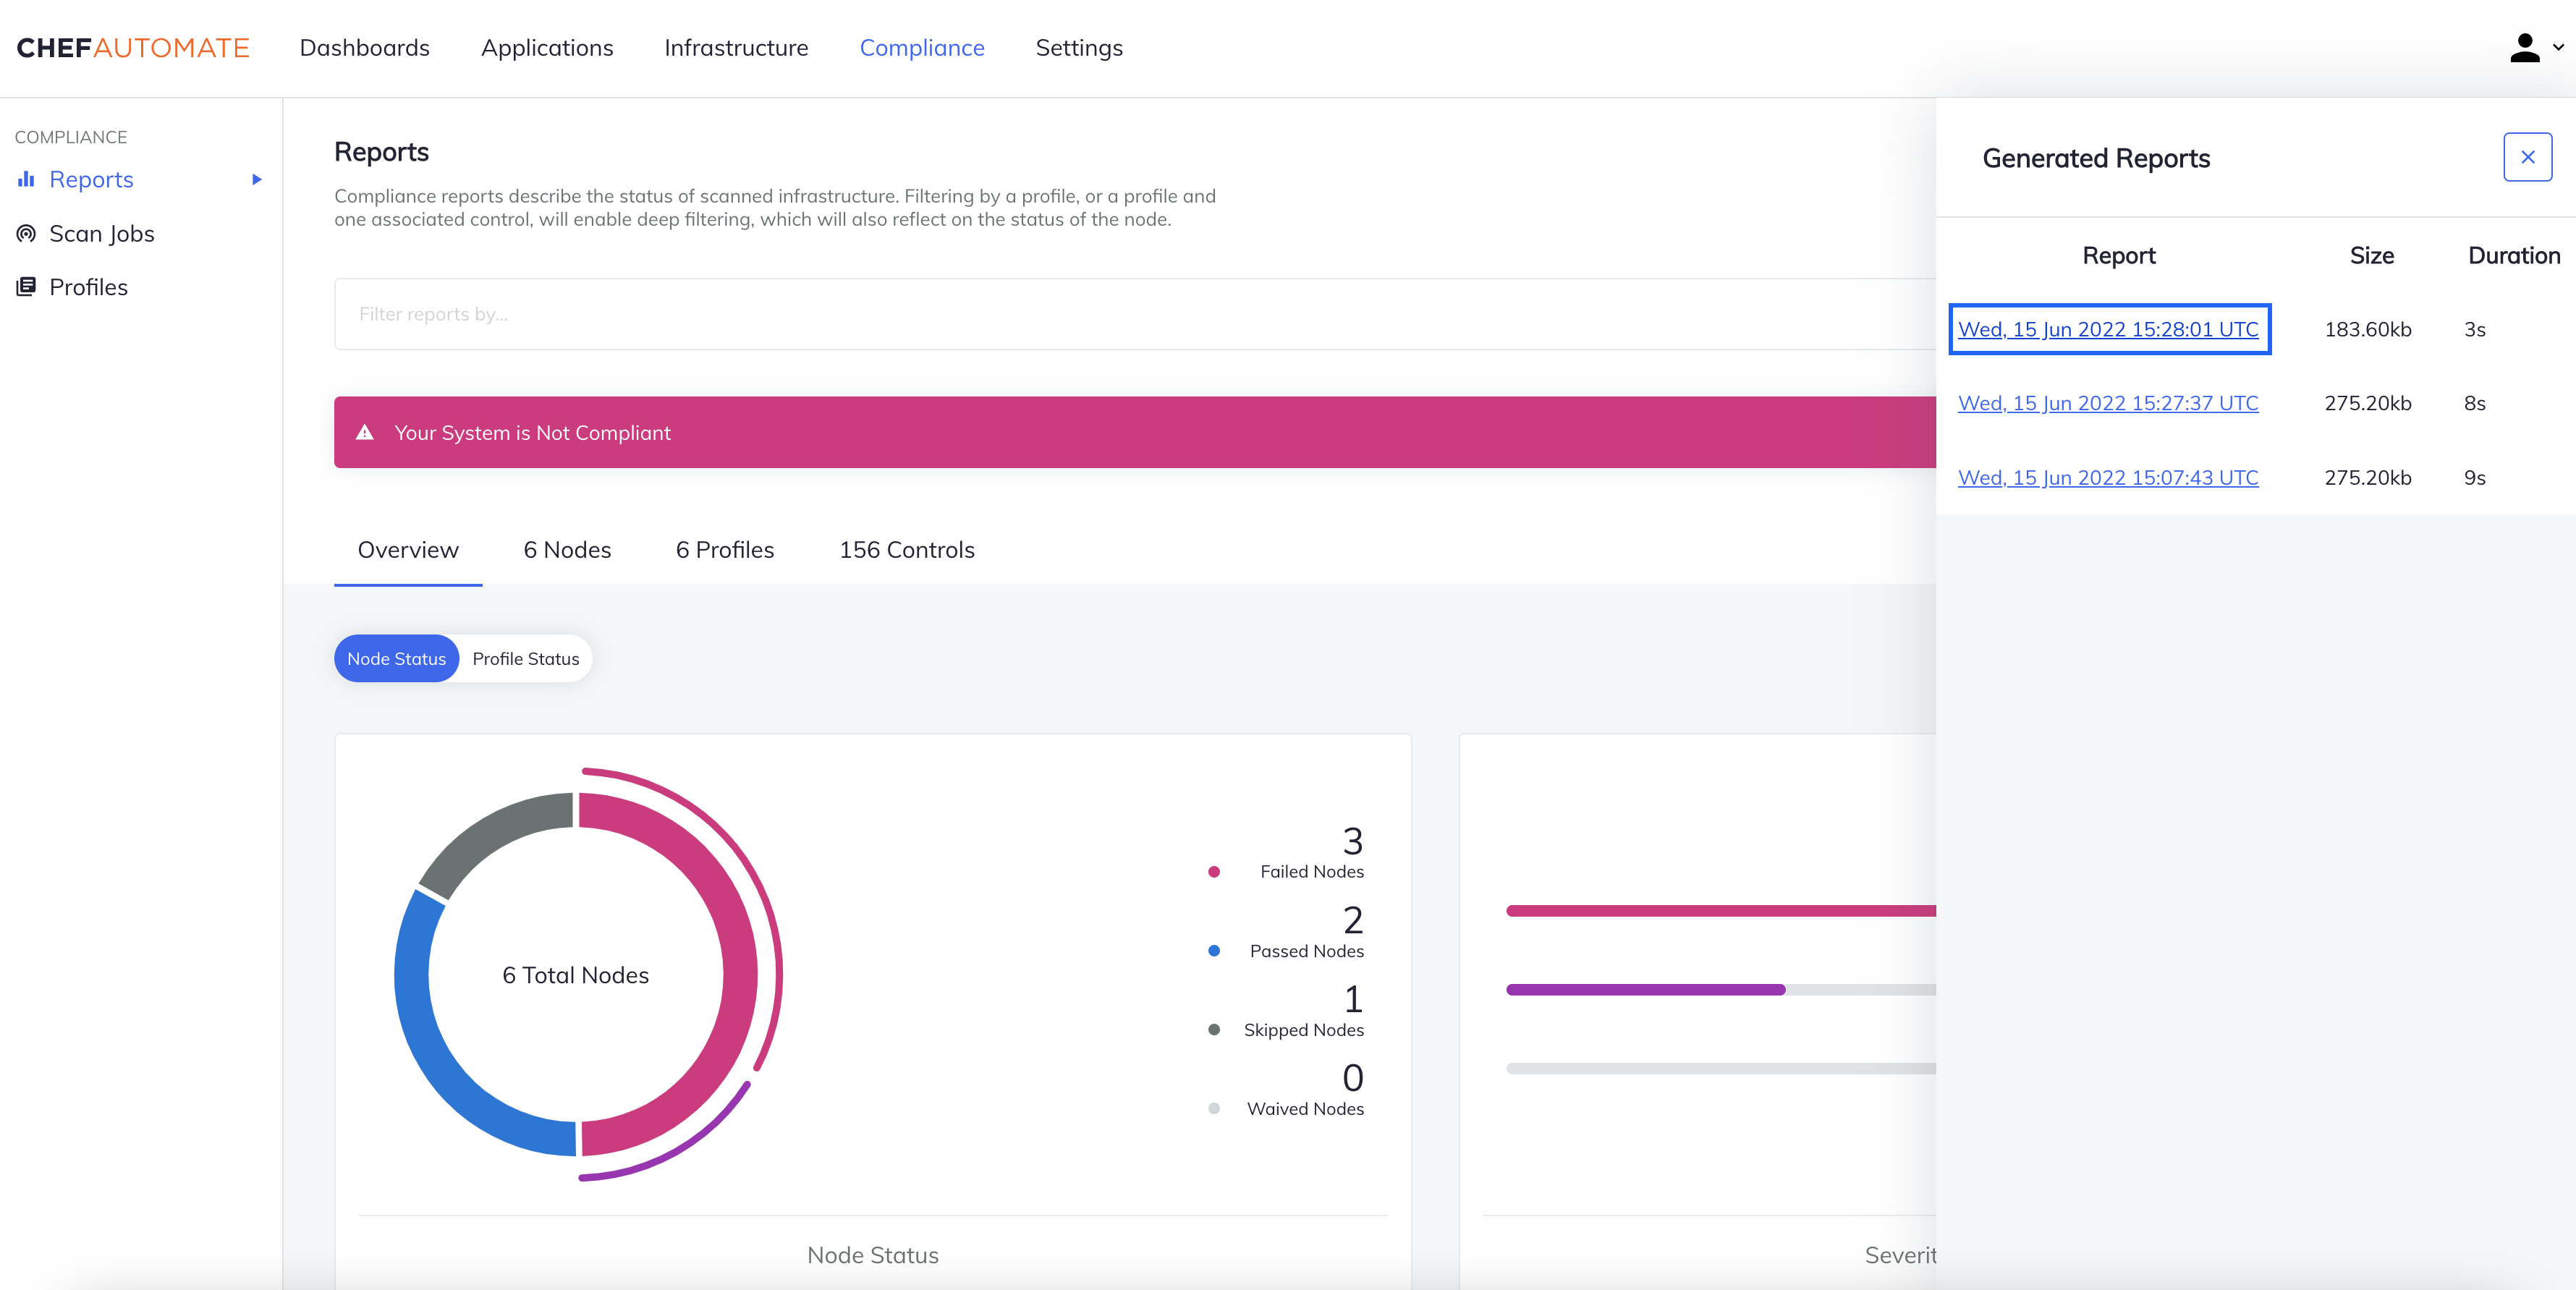
Download Report
Select the corresponding link on the status sidebar to download the generated report.
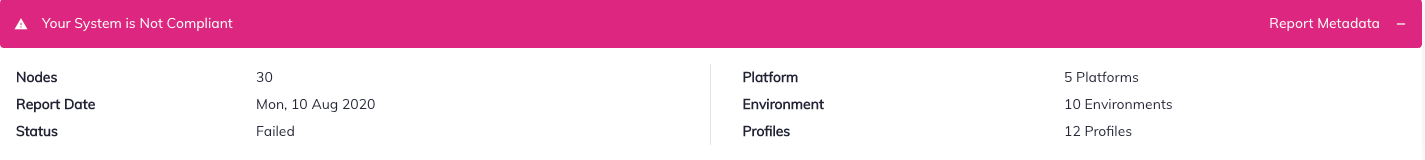
Compliance Status and Report Metadata
The Compliance Status and Report Metadata bars are directly beneath the search bar. Select the compliance status bar to expand the Report Metadata information. The report metadata summarizes the nodes, report date, duration, status, number of platforms, number of environments, and number of profiles used in your scan.
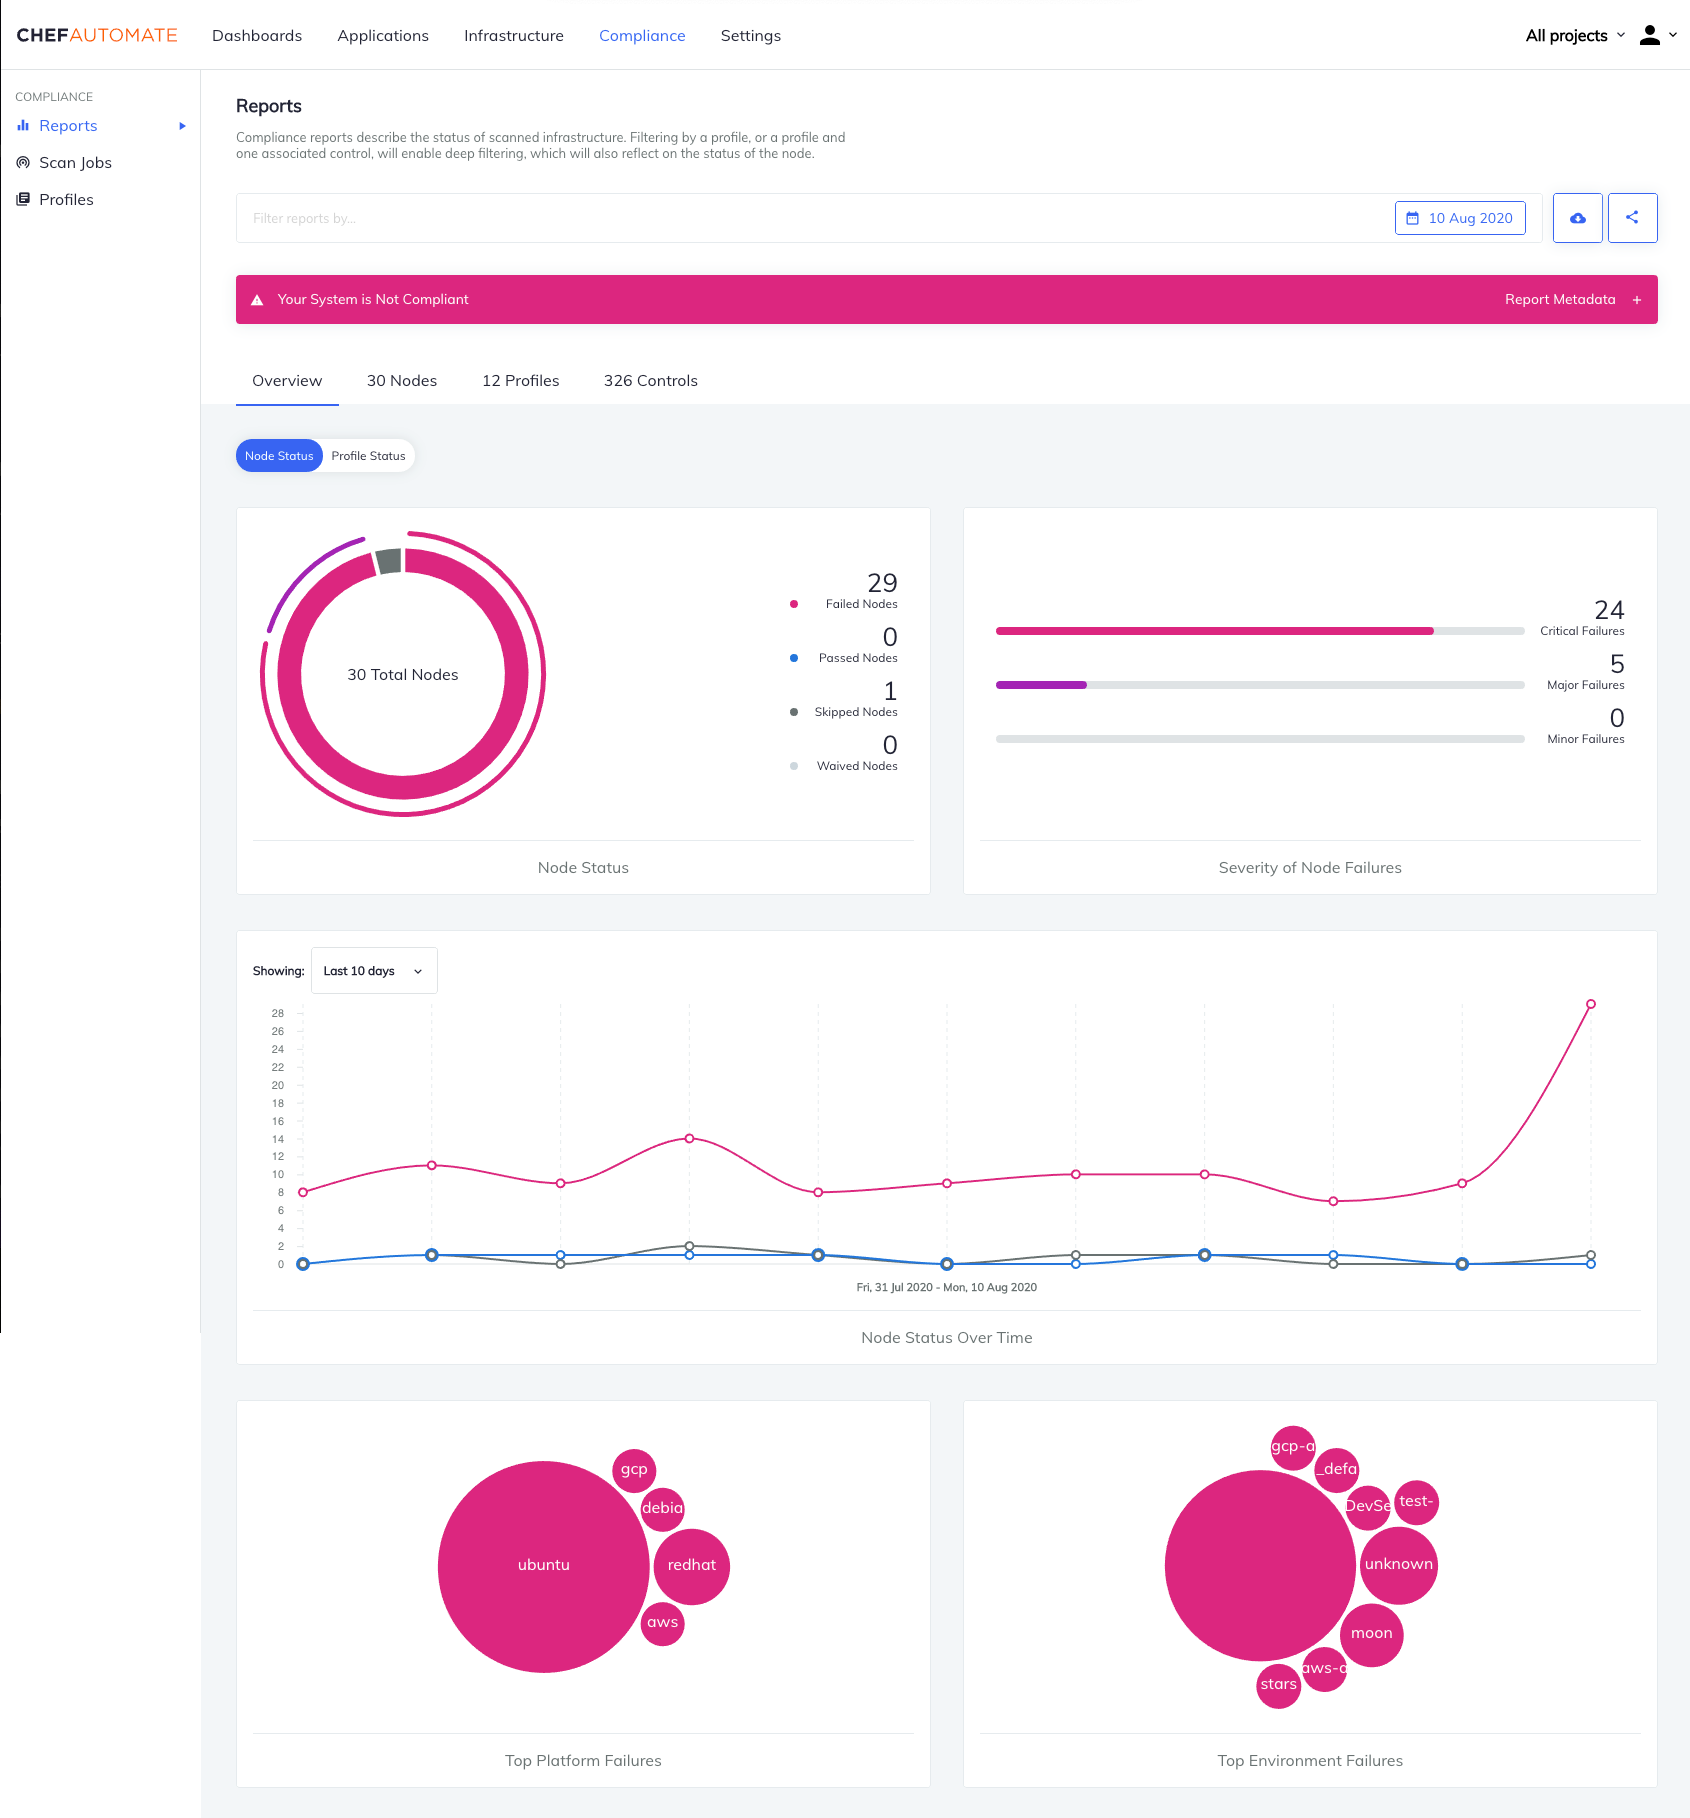
Compliance Overview
Toggle between Node Status and Profile Status to view your system’s compliance state.
Node Status
The Node Status view shows your system’s compliance status from the operational perspective of nodes.
- Node Status
- Shows the number of nodes that passed or failed compliance scans and the number of skipped or waived nodes.
- The severity of Node Failures
- Shows the severity of the compliance scan failures on your system’s nodes.
- Node Status Over Time
- Shows the changes in size and compliance status of your system over time. Use the dropdown menu in the upper left corner to change the date range. Changing the date range also changes the displays in related charts and tables.
- Top Platform Failures
- Shows the number of compliance scan failures grouped by the operating system. Hovering over an individual bubble shows the platform name and the number of failed nodes.
- Top Environment Failures
- Shows the number of compliance scan failures grouped by the environment. Hovering over an individual bubble shows the environment name and the number of failed nodes.
Profile Status
The Profile Status view shows your system’s compliance status from the compliance perspective of Compliance profiles run during scans.
Note
- Control Status
- Shows the number of controls in your system, grouped by passing, failing, and skipped controls.
- The severity of Control Failures
- Shows failed controls, ranked by number and importance of the control failure, grouped as critical, major, and minor.
- Control Status Over Time
- A line graph showing the number of controls and Compliance scan results over time. Use the calendar button in the upper right corner of the chart to change the time frame.
- Top Profile Failures
- Indicates the profiles with the highest failure rate. Hover over an individual bubble to show the full profile name and the number of failed nodes.
- Top Control Failures
- Indicates the most frequently failing controls. Hover over an individual bubble to show the control name and the number of failed nodes.
Switching Views
Switch your views by selecting the appropriate tabs and see compliance report results from the perspective of Nodes, Profiles, and Controls.
Nodes
The Nodes view provides more detailed insight into the compliance status of the nodes in your system. Sort this table by node name, platform, environment, last scan, and the number of control failures from the most recent compliance scan. Scroll to the bottom of the page for pagination navigation options.
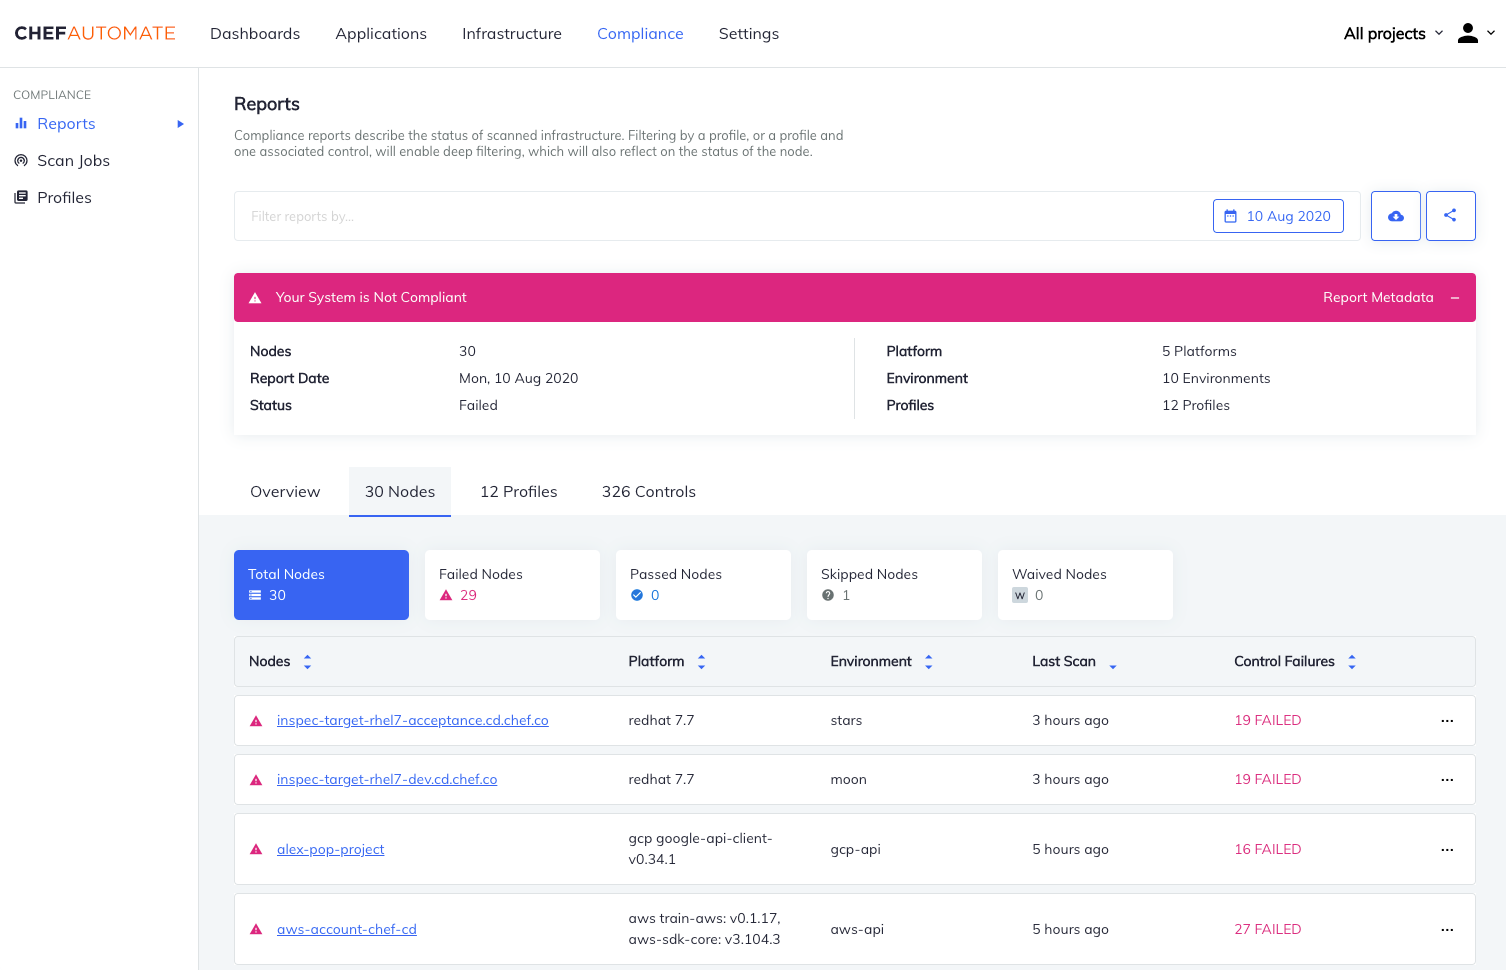
- Node
- A node is any machine that’s under management by Chef.
- Platform
- The operating system on your nodes, such as AIX, Amazon Linux, Apache, macOS, CentOS, Oracle Linux, Oracle Solaris, RHEL, SUSE Linux, Ubuntu, and Windows.
- Environment
- You can filter compliance reports by the environments at any stage of your workflow.
- Last Scan
- Time in hours, days, or months since the previous scan on that node.
- Control Failures
- Shows the number of failing controls, if any.
- Filter
- Select the filter icon on the right side of the row to select a node.
- More Options
- Select the ellipses icon
to display a menu with two options: Add Filter and Scan Results. Use Add Filter to narrow the results to the
idof the selected node. Use Scan Results to show the scan results of controls for the specific node in a side window.
Profiles
Use the Profiles tab to examine the compliance profiles installed under your user account.
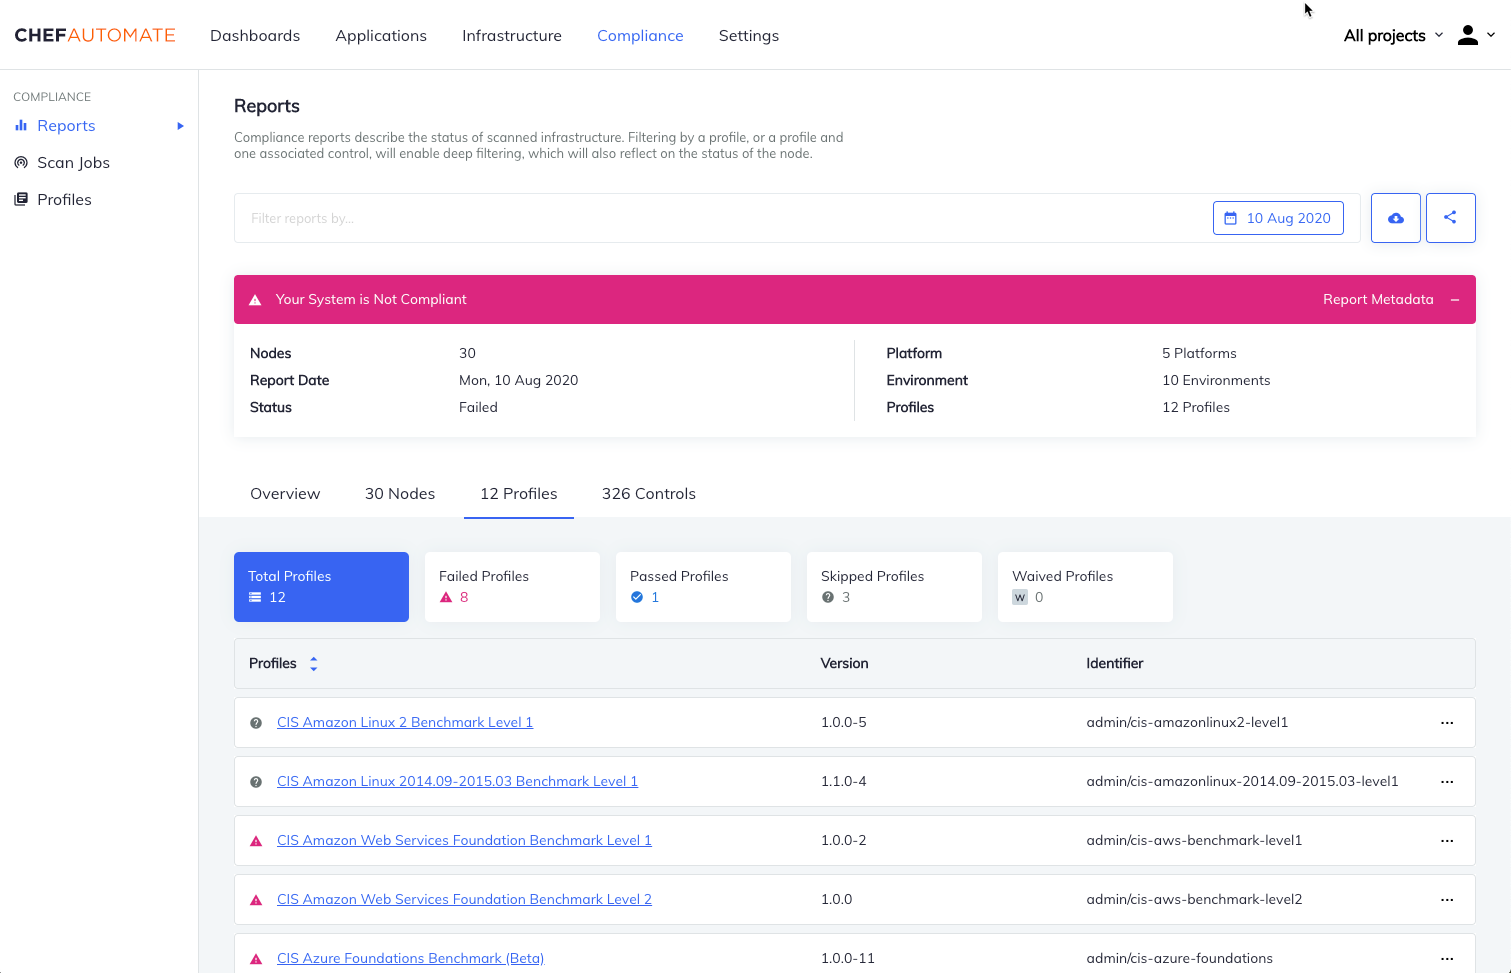
- Profile Title
- The profile’s name is obtained from the Profile Store or uploaded.
- Version
- The semantic version identifier of the profile; you may need to update your profiles to get the most recent version.
- Identifier
- The name under which the profile is installed and a short profile title.
- More Options
- Select the ellipses icon
to display a menu with two options: Add Filter and Scan Results. Use Add Filter to narrow the results to the
idof the selected profile. Use Scan Results to show the scan results of controls for the specific node in a side window.
Controls
Use the Controls tab to examine the compliance controls installed under your user account.
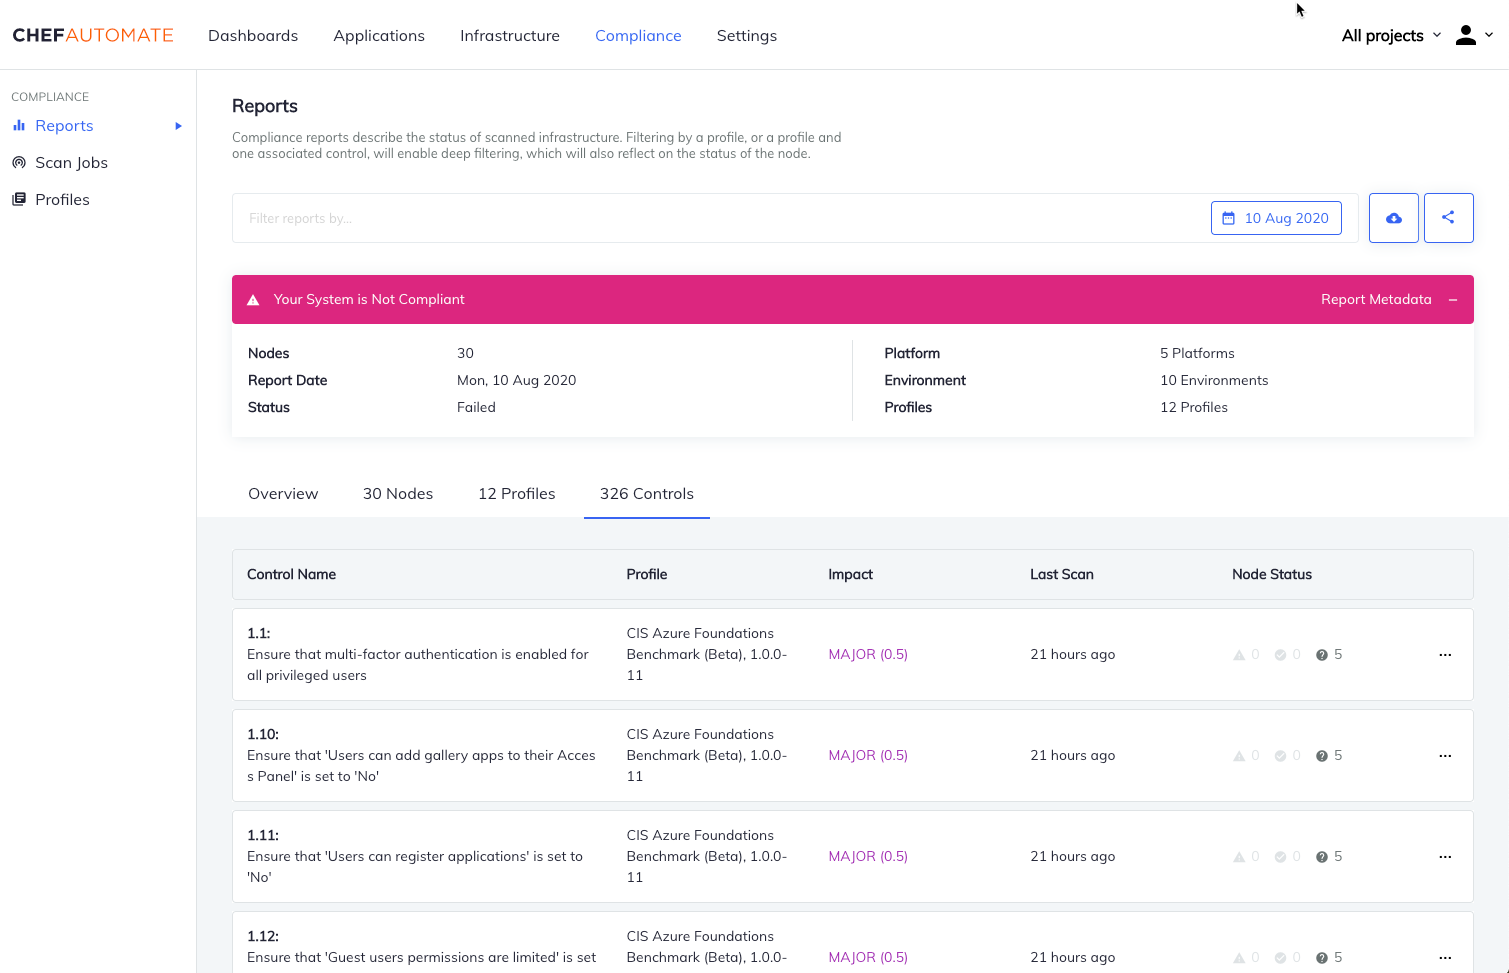
- Control Name
- Control name and a short description of its purpose
- Profile
- Profile containing the controls
- Impact
- Importance of the control
- Last Scan
- When the last scan occurred
- Node Status
- Shows the number of failed, passed, and skipped nodes
- More Information
- Select the ellipses icon
to display a menu with one option: Add Filter. Use Add Filter to narrow the results to the
idof the selected profile and theidof the selected control.
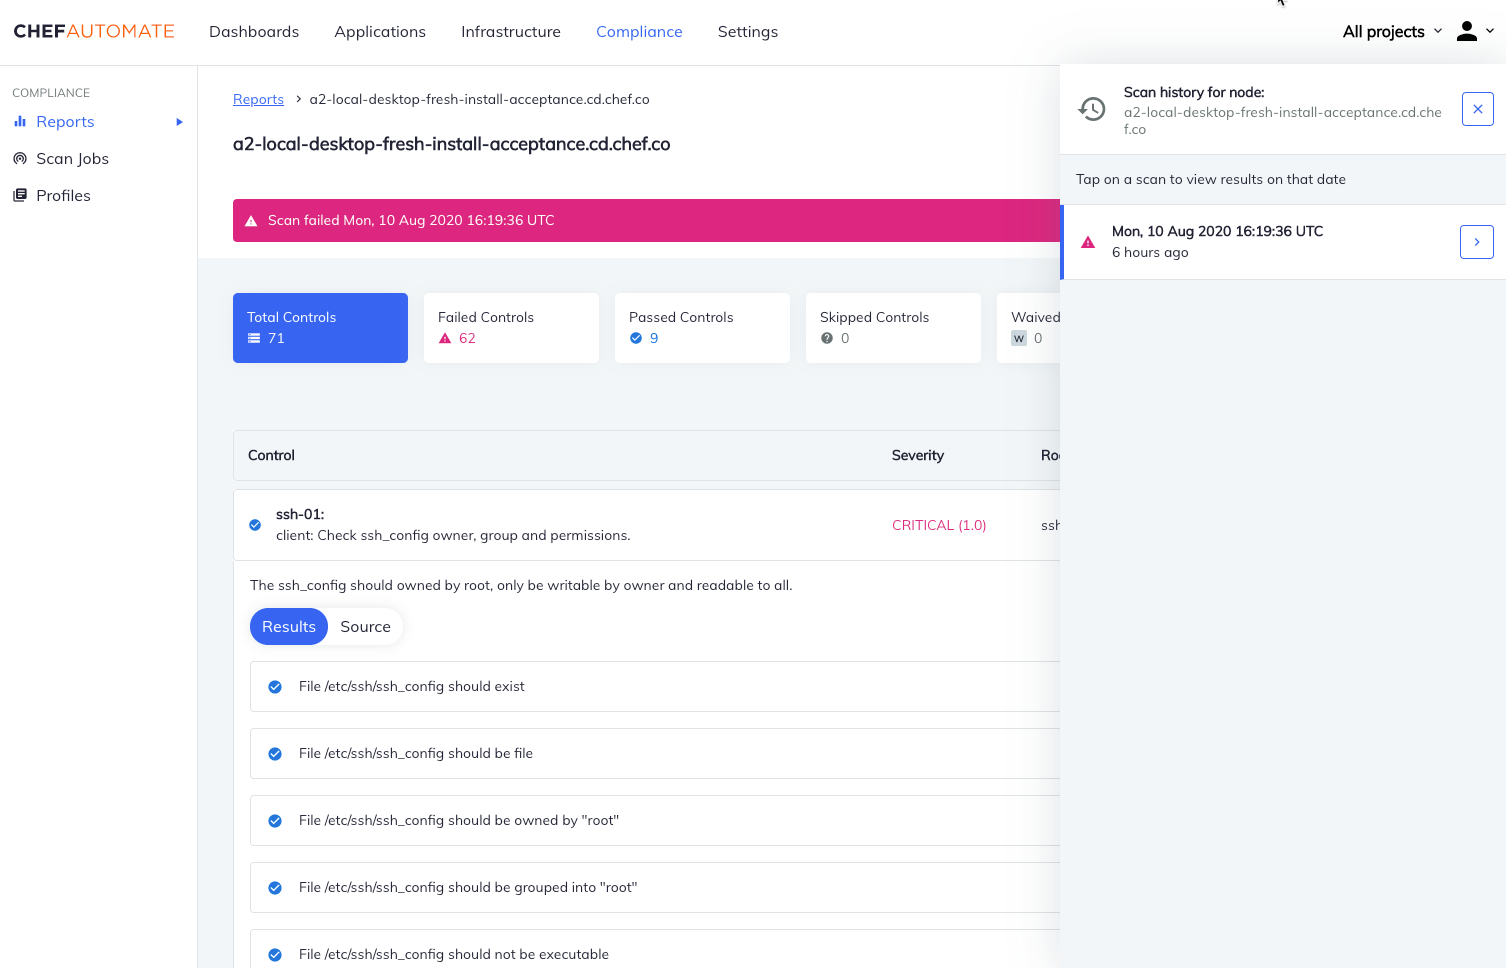
Individual Node Display
The node name is at the top of the header, directly above the node compliance status.
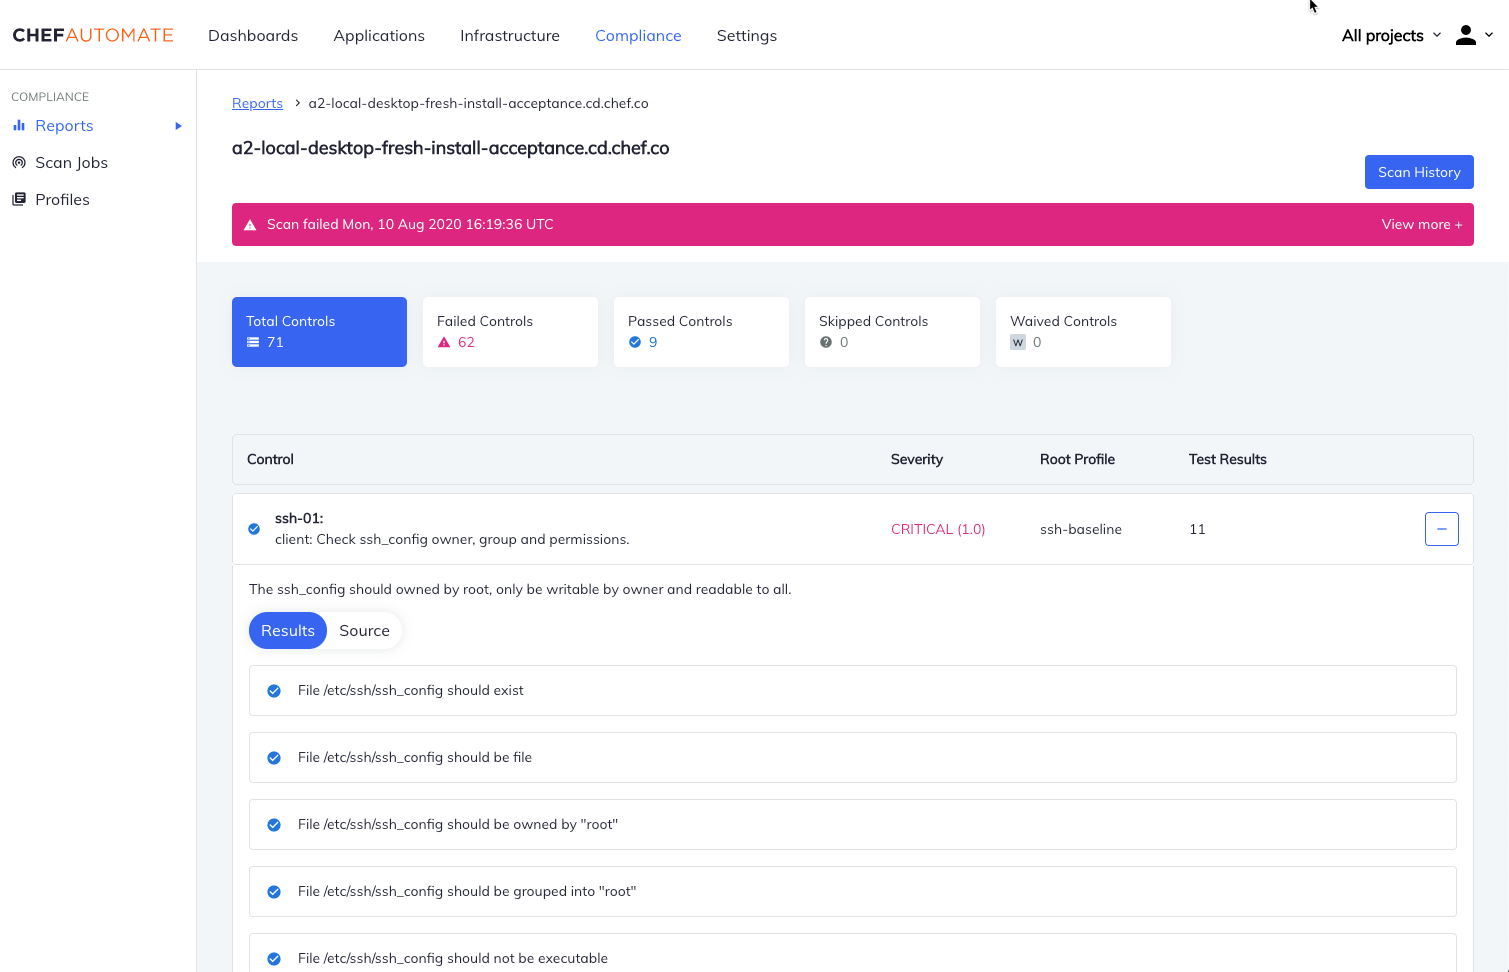
The node history table displays the following information:
- Control
- Control name and a short description of its purpose
- Severity
- Importance of the control
- Root Profile
- Profile containing the controls
- Test Results
- Number of tests within an individual control
- More Information
- Select the plus icon to display a control description and toggle between Results, and Source. Results describes the node compliance status, and Source shows the Chef InSpec control source code.
Scan History
Select Scan History in the upper right corner to open a side-window. Choosing a compliance scan from this list redirects you to a view of all controls run during the selected scan.